はじめに
行列式を用いることで、複雑な多項式の因数分解を行うことができる。
そこで、今回は3次式の多項式を2次式と1次式の多項式の積の形に因数分解する公式を紹介し、証明を行う。次に、具体例を考え、その行列式で表された関数がどのような曲面を描くのか考察する。
導入
以下の因数分解の公式を行列式を用いて証明せよ。
x^3+y^3+z^3-3xyz=(x+y+z)(x^2+y^2+z^2-xy-yz-zx)
証明
I=

\begin{vmatrix}
   x & y & z\\
   z & x & y\\
   y & z & x

\end{vmatrix}
これを、2通りの方法で計算する。
余因子展開
I=x \begin{vmatrix}
   x & y \\
   z & x
\end{vmatrix}

-
z \begin{vmatrix}
   y & z \\
   z & x
\end{vmatrix}

+

y \begin{vmatrix}
   y & z \\
   x & y
\end{vmatrix}

=x(x^2-xy) -z(xy-z^2)+y(y^2-xz)=x^3+y^3+z^3-3xyz
因数分解
行列式の定義
突然だが、3×3の行列式は、3つのベクトルを辺とした平行六面体の体積である。
つまり、
\begin{vmatrix}
   a & 0 & 0\\
   0 & b & 0\\
   0 & 0 & c

\end{vmatrix}

=abc
である。つまり、3×3の行列式は3×3の行列の3つの固有値の積である。
固有値
一方で、
\textbf{A}=

\begin{pmatrix}
   x & y & z\\
   z & x & y\\
   y & z & x

\end{pmatrix}
とする。この行列の固有値を考えよう。
\begin{pmatrix}
   x & y & z\\
   z & x & y\\
   y & z & x

\end{pmatrix}

\begin{pmatrix}
   1\\
   1\\
   1

\end{pmatrix}

=(x+y+z)


\begin{pmatrix}
   1\\
   1\\
   1

\end{pmatrix}
ここで、$\omega^3=1$となる複素数$\omega$を導入する。
\begin{pmatrix}
   x & y & z\\
   z & x & y\\
   y & z & x

\end{pmatrix}

\begin{pmatrix}
   1\\
   \omega\\
   \omega^2\\

\end{pmatrix}

=(x+y\omega^2+z\omega)


\begin{pmatrix}
   1\\
   \omega\\
   \omega^2\\

\end{pmatrix}
\begin{pmatrix}
   x & y & z\\
   z & x & y\\
   y & z & x

\end{pmatrix}

\begin{pmatrix}
   1\\
   \omega^2\\
   \omega\\

\end{pmatrix}

=(x+y\omega+z\omega^2)


\begin{pmatrix}
   1\\
   \omega^2\\
   \omega\\

\end{pmatrix}
つまり、$\textbf{A}$の固有値は、$(x+y+z)
,(x+y\omega^2+z\omega)
,(x+y\omega+z\omega^2)$となる。
したがって
x^3+y^3+z^3-3xyz=(x+y+z)(x+y\omega^2+z\omega)(x+y\omega+z\omega^2)=(x+y+z)(x^2+y^2+z^2-xy-yz-zx)
となり、題意は示された。
数値計算
さて、$z$が定数のとき
I=

\begin{vmatrix}
   x & y & z\\
   z & x & y\\
   y & z & x

\end{vmatrix}
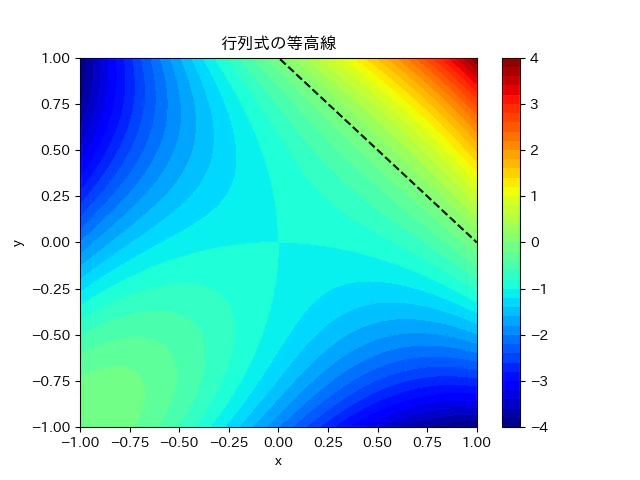
という等高線グラフを$xy$平面に図示したい。
I=(x+y+z)(x^2+y^2+z^2-xy-yz-zx)
例えば、$z=1$の場合は以下のようになる。
I=(x+y+1)(x^2+y^2+1-xy-y-x)
ここで、$I_0=x+y+1$、$I_1=x^2+y^2+1-xy-y-x$であるとする。
$I_0=x+y+1$は直線面を示す。
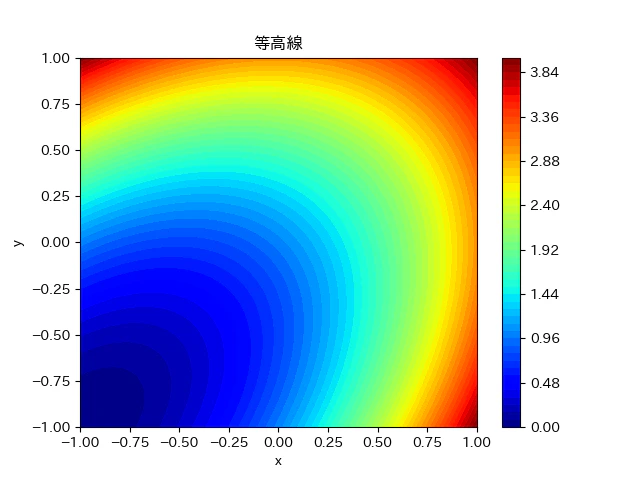
$I_1=x^2+y^2+1-xy-y-x$は、以下のような二次曲面を示す。
プログラム
以下のようなプログラムを作成した。
python matrix_3d.py
import numpy as np
import matplotlib.pyplot as plt
import japanize_matplotlib
import math

def det_matrix(x,y,z):
    z_matrix=np.array([[x,y,z],[z,x,y],[y,z,x]])
    #z2=(x**2+y**2+z**2-(x*y+y*z+z*x))*(x+y+z)
    return np.linalg.det(z_matrix)
    #return z2

L=1
n=100
x_ary=np.linspace(-L,L,n)
y_ary=np.linspace(-L,L,n)
X,Y=np.meshgrid(x_ary,y_ary)
Z=np.zeros((n,n))

z=-1

for i in range(n):
    for j in range(n):
        Z[i][j]=det_matrix(X[i][j],Y[i][j],z)

plt.contourf(X,Y,Z,levels=50,cmap='jet')
plt.plot(x_ary,-z-x_ary,'k--')  # x+y=1の線を追加

plt.xlim(-L,L)
plt.ylim(-L,L)

plt.colorbar()
plt.xlabel('x')
plt.ylabel('y')
plt.title('行列式の等高線')
plt.savefig('行列式の等高線.png')
plt.show()
このプログラムを実行すると以下のようになる。
ある直線を境にしていることが分かる。
まとめ
今回は、巡回行列の行列式を用いて、3次式の因数分解を行なった。
また、その因数分解を利用して、3次曲線の特性を予測した。
参考文献