はじめに
Microsoft BuildのBuild intelligent applications infused with world-class AIセッションで紹介されていたAnomaly Detector 多変量 APIについて触れていきます。
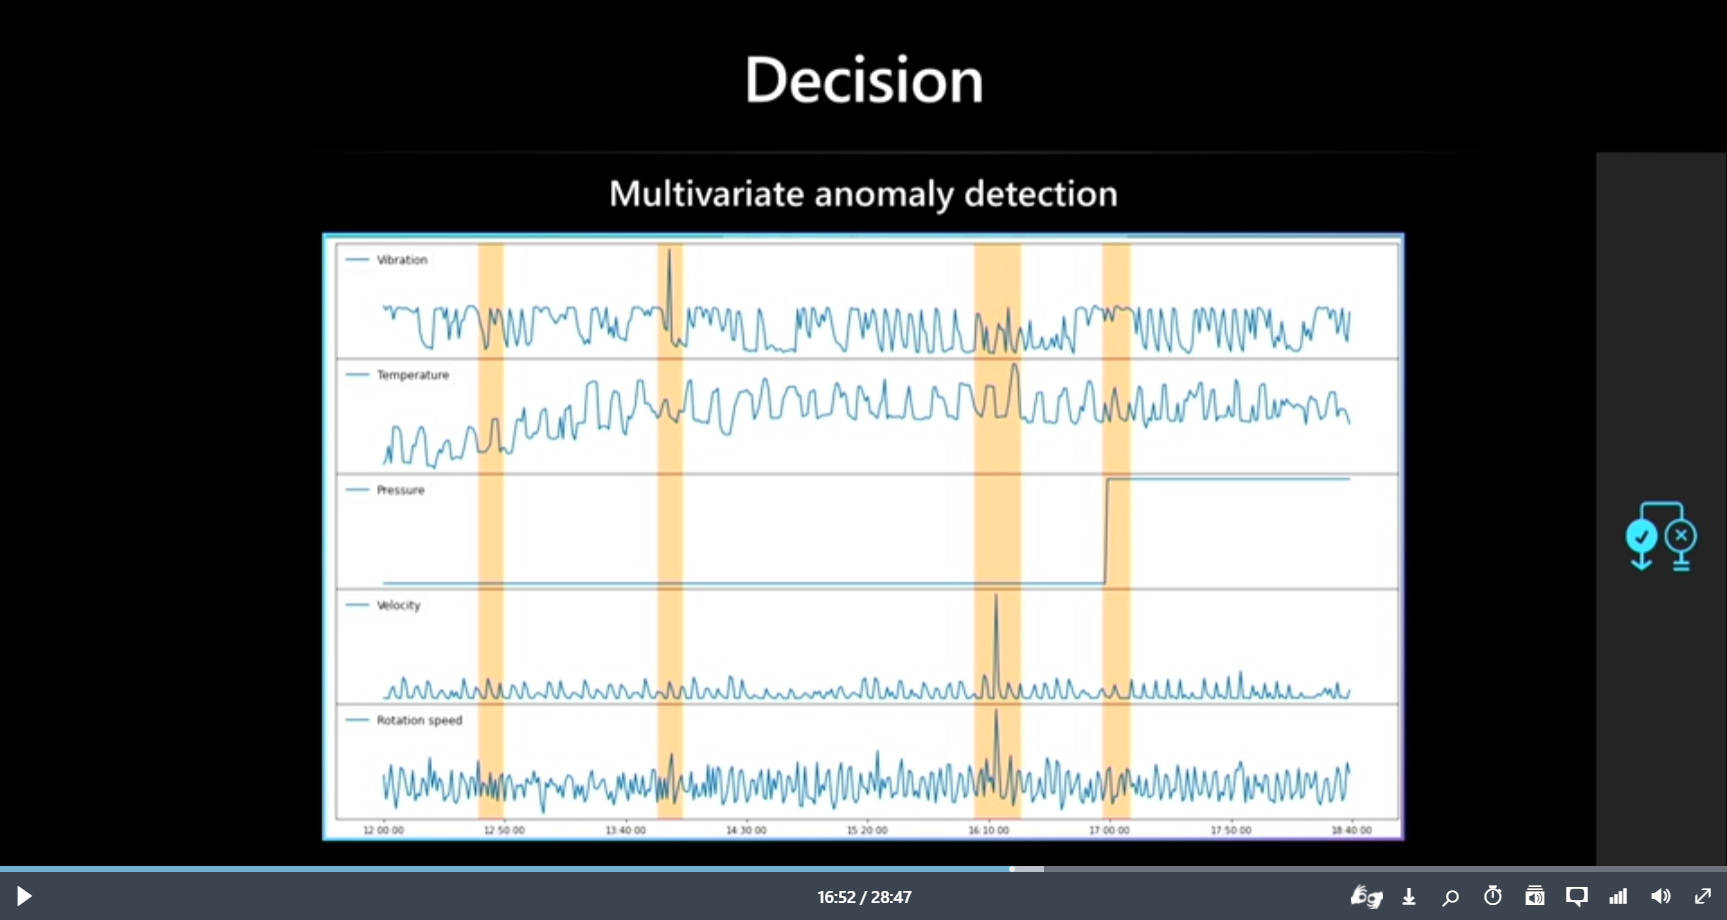
本APIはセッションではサラッと紹介されていたのですが、多くの場面での活用が期待できるとても良いサービスになっています。
是非使ってみて頂きたいオススメ機能の一つです。
この記事の想定読者
- Azureの多変量時系列データの異常検知に興味のある方
- 多変量時系列データの異常検知を実業務に活用したいと検討している方
Anomaly Detector/Anomaly Detection(異常検知)とは
異常検知(Anomaly Detection)とは、データの特性上多く見られるパターン(正常なパターン)とは異なる挙動(異常なパターン)を検出する技術のことです。
Anomaly Detectorとは、Anomaly Detectionを行うための分類モデルの学習と推論機能を提供するAzureのサービスです。
Anomaly Detectorは、入力データの特性から異常かどうかを学習した上で判定するため、教師ラベル(ある時点でのデータが正常であるか、異常であるかの情報)を必要としない「教師なし学習」で分類モデルを学習できます。そのため、予め正常であるか、異常であるかの判断が難しいような事例にも適用することが可能です。
例えば、以下のような活用シーンが考えられます。
- 工場の稼働データから異常な状態であるかを判定する
- 人の動作データから異常な動きを検知する
- クレジットカードの不正利用があったかを検知する など
このように多くの場面での活用が期待できるサービスになっています。
詳しい方向け
Anomaly Detectorの学習アルゴリズムはアテンション系が使われています。
流行りの手法を用いるあたり流石MS様です。
機能検証にあたり実施すること
- Azure環境の準備
- Anomaly Detectorリソースの作成
- サンプルデータの入手
- Anomaly Detector APIを用いた異常検知
では触ってみましょう
1. Azure環境の準備
会社等で既にAzure環境をお持ちの方はそちらをお使いください。
お持ちでない方は無料アカウントをお使いください。
無料アカウントの作成方法はMS Learnの手順をご参照ください。
2. Anomaly Detectorリソースの作成
-
Azure Portalにログインします。
-
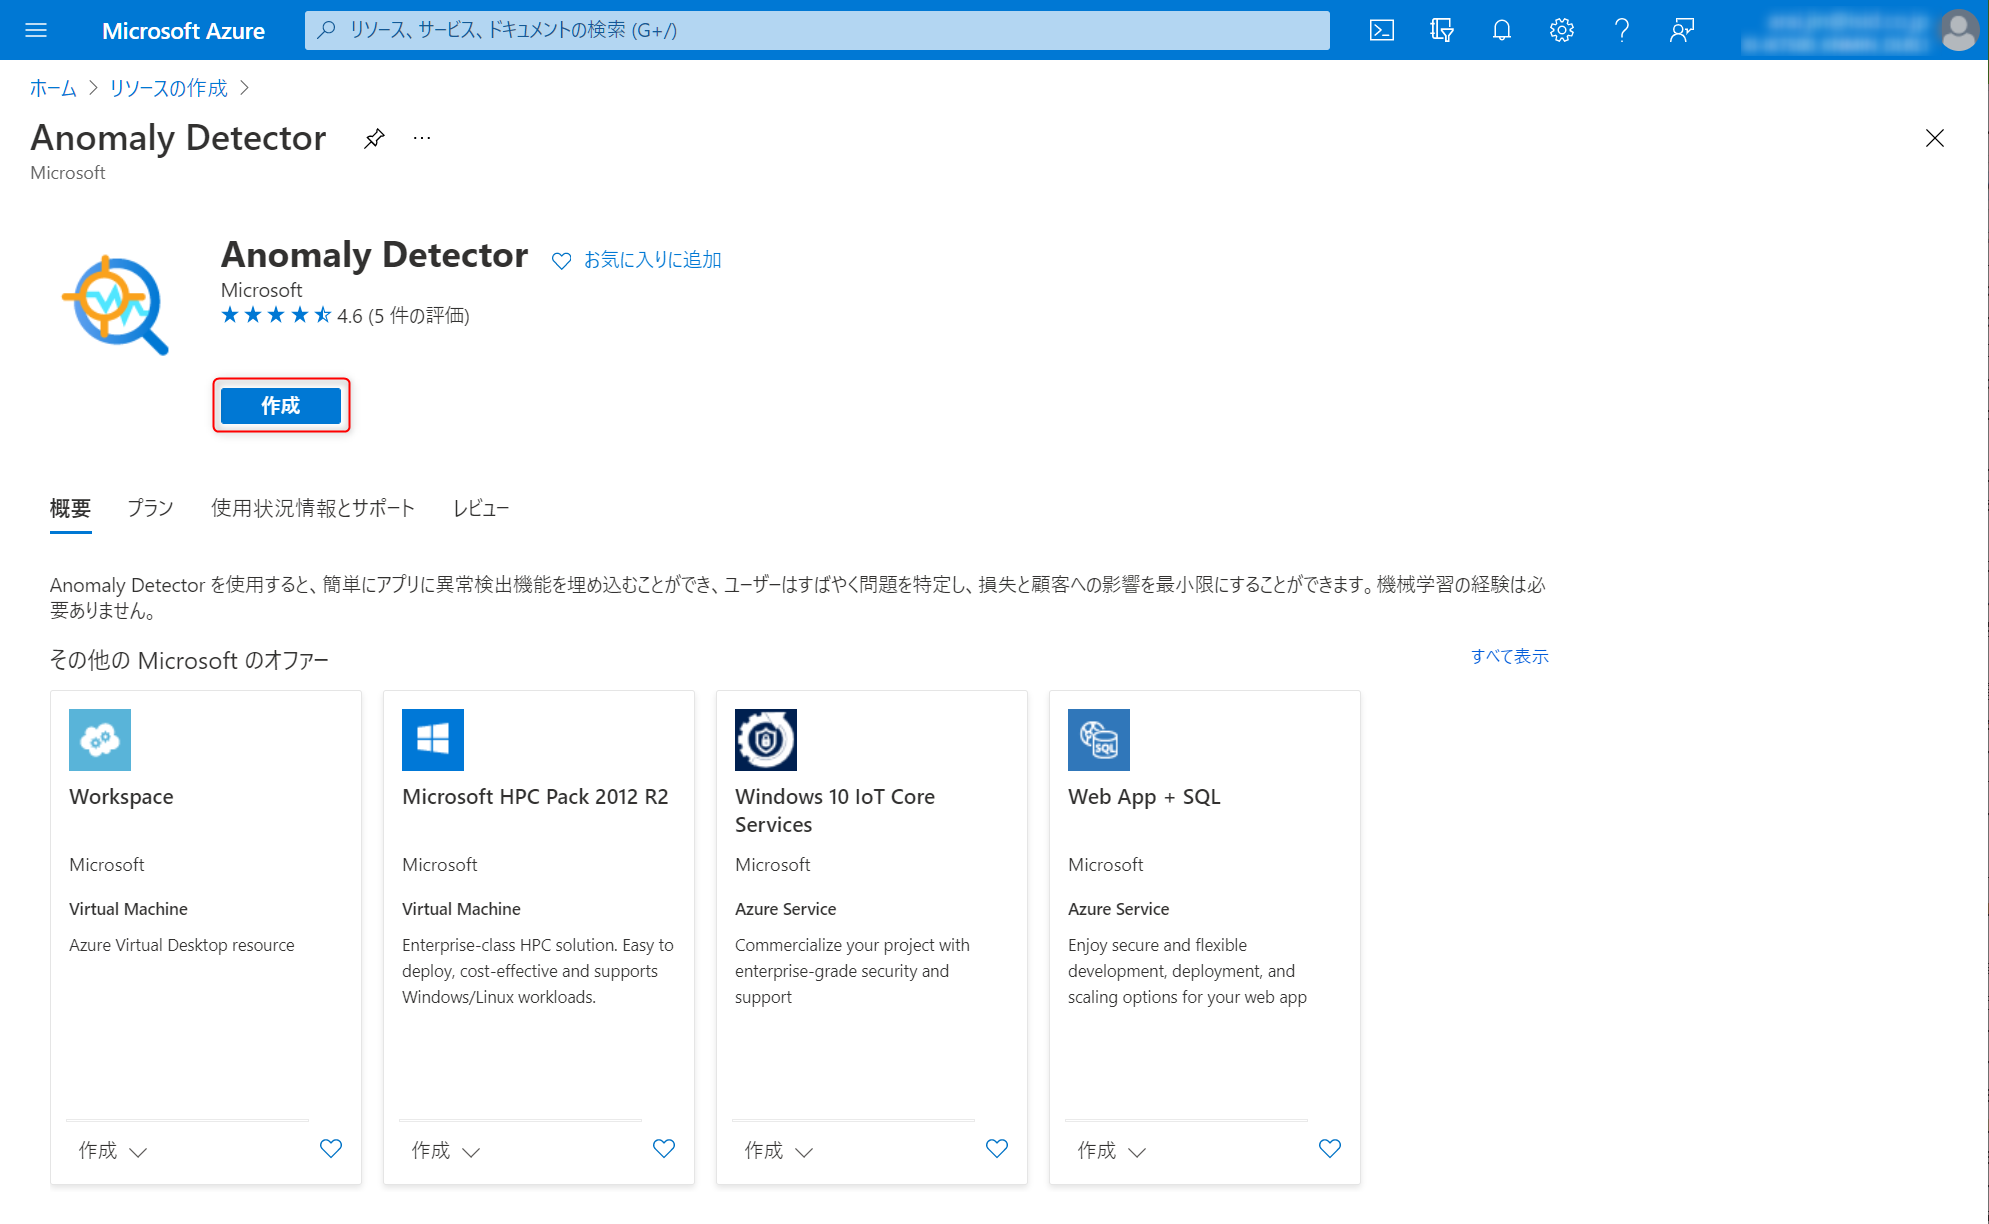
リソースの作成画面の検索バーに
Anomaly Detectorと入力します。そうすると、サービスが検索結果リストからAnomaly Detectorをクリックします。

-
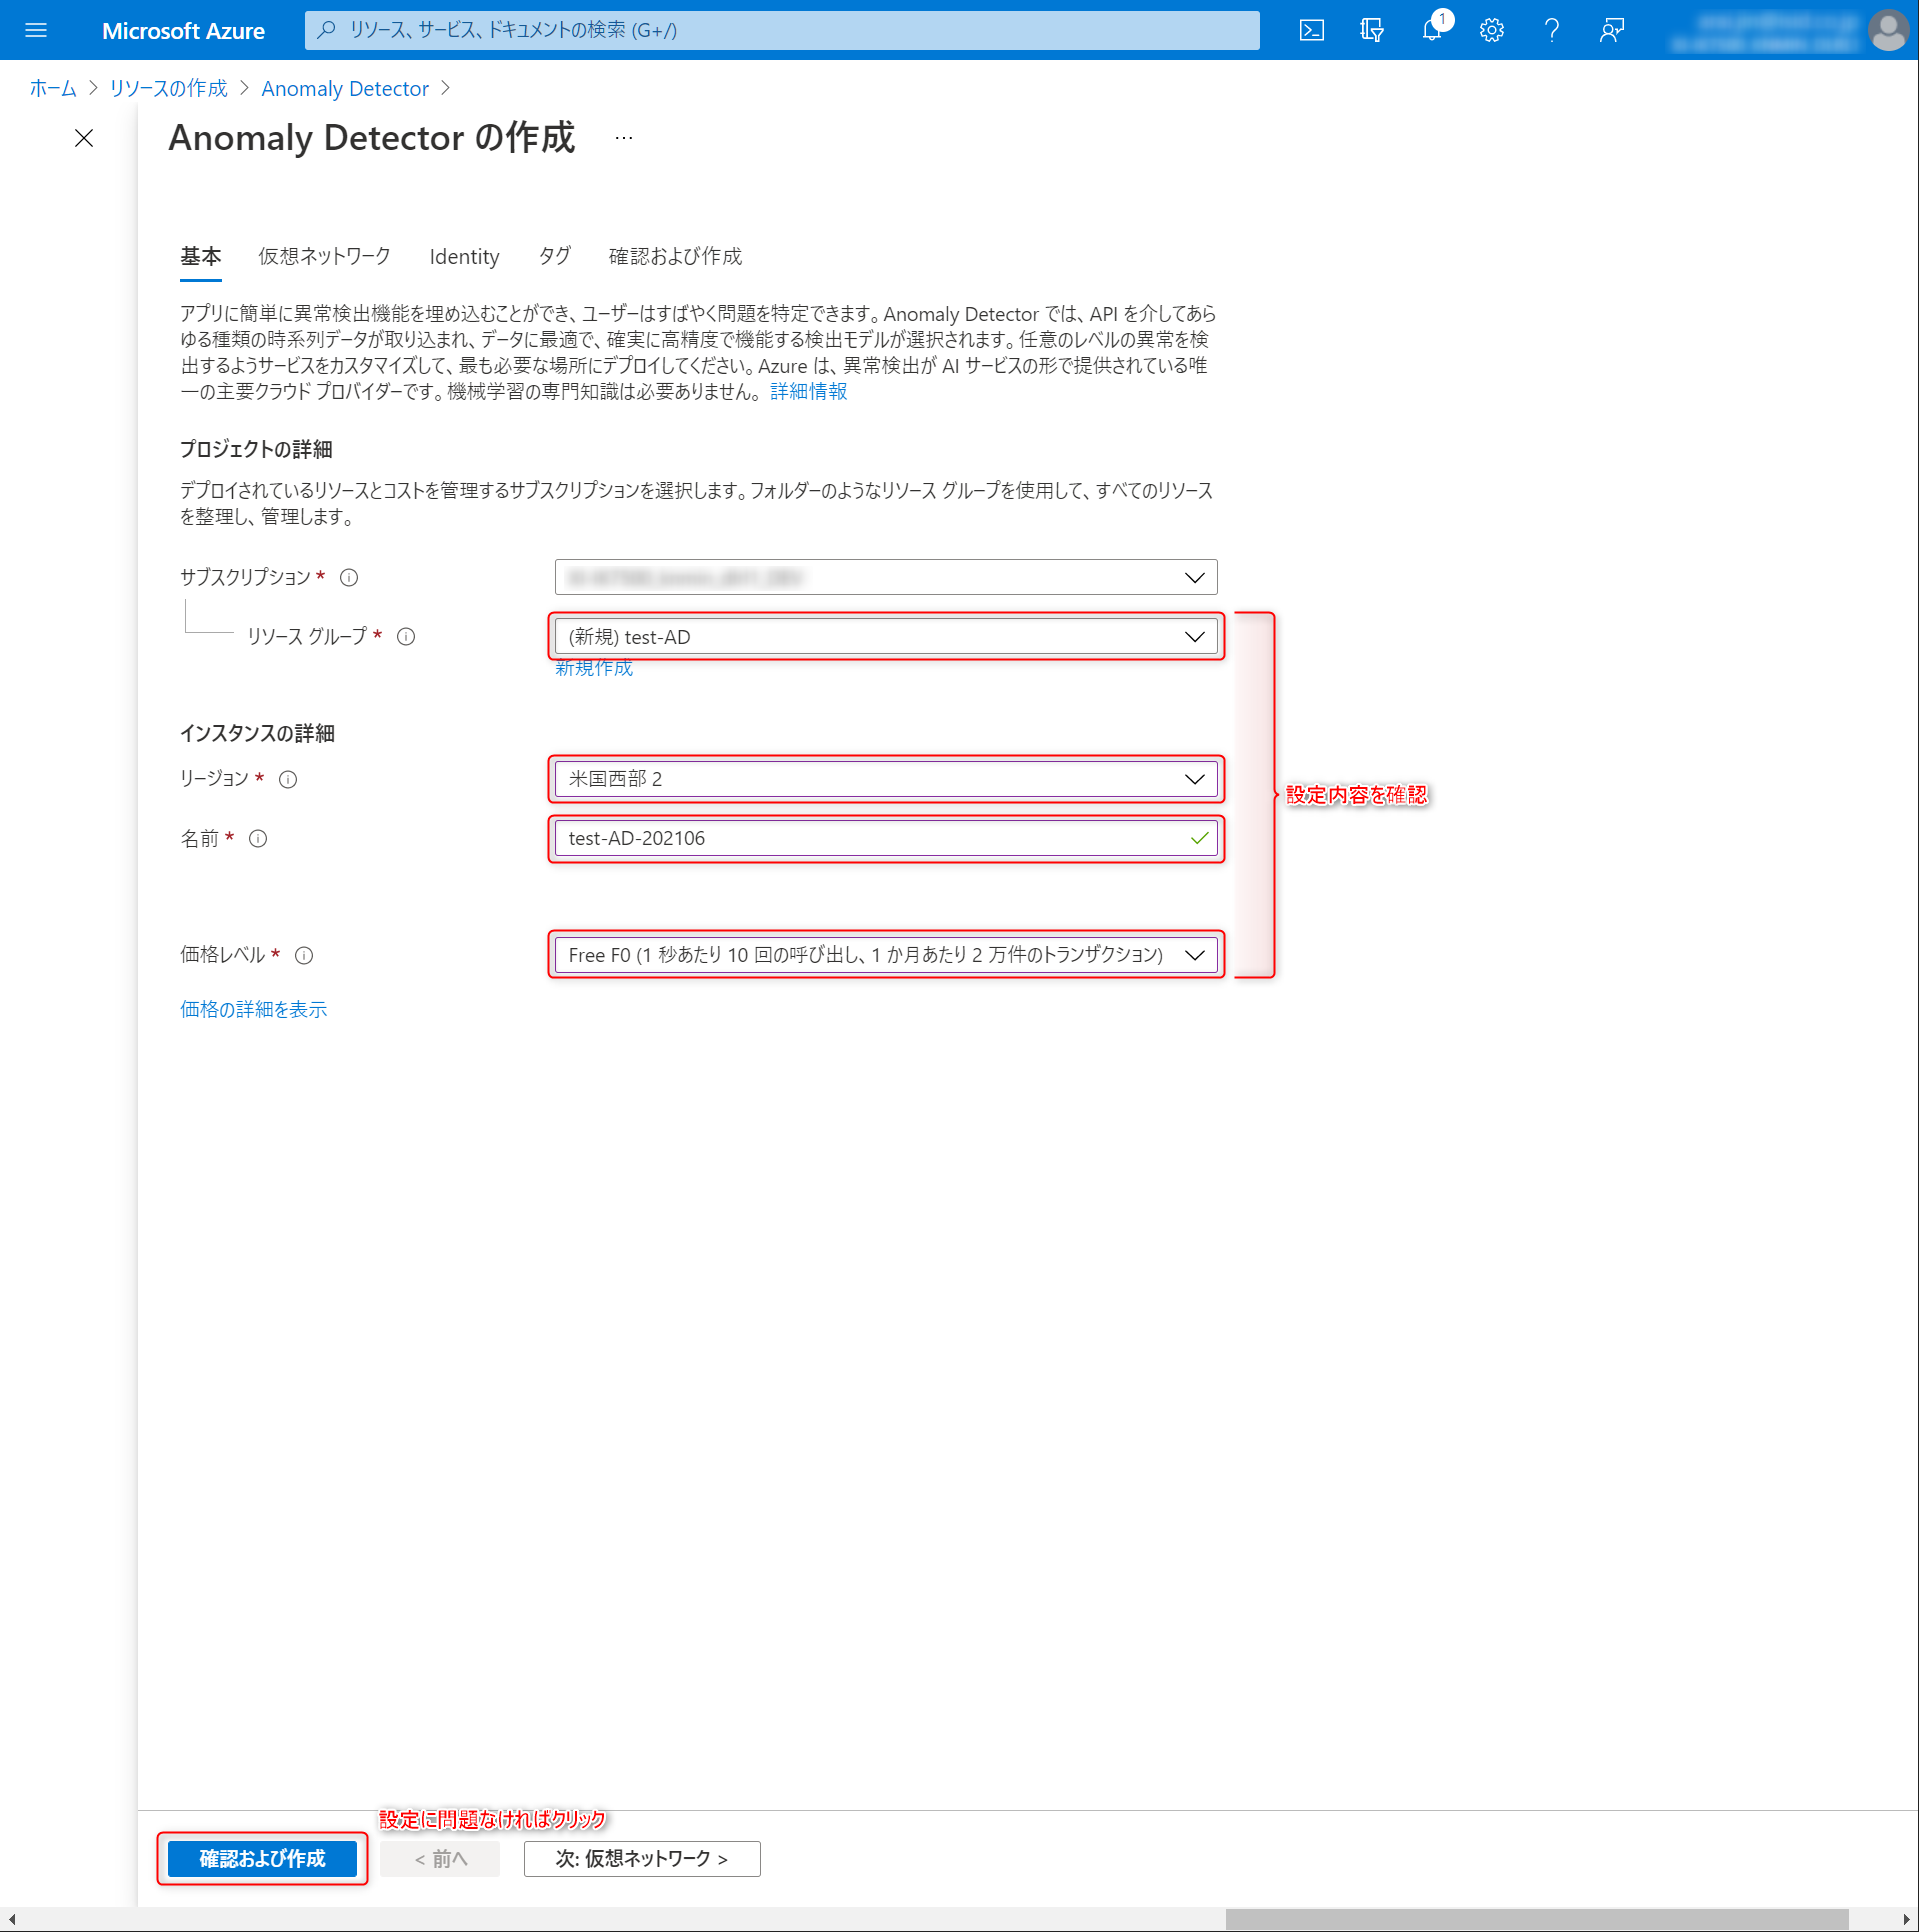
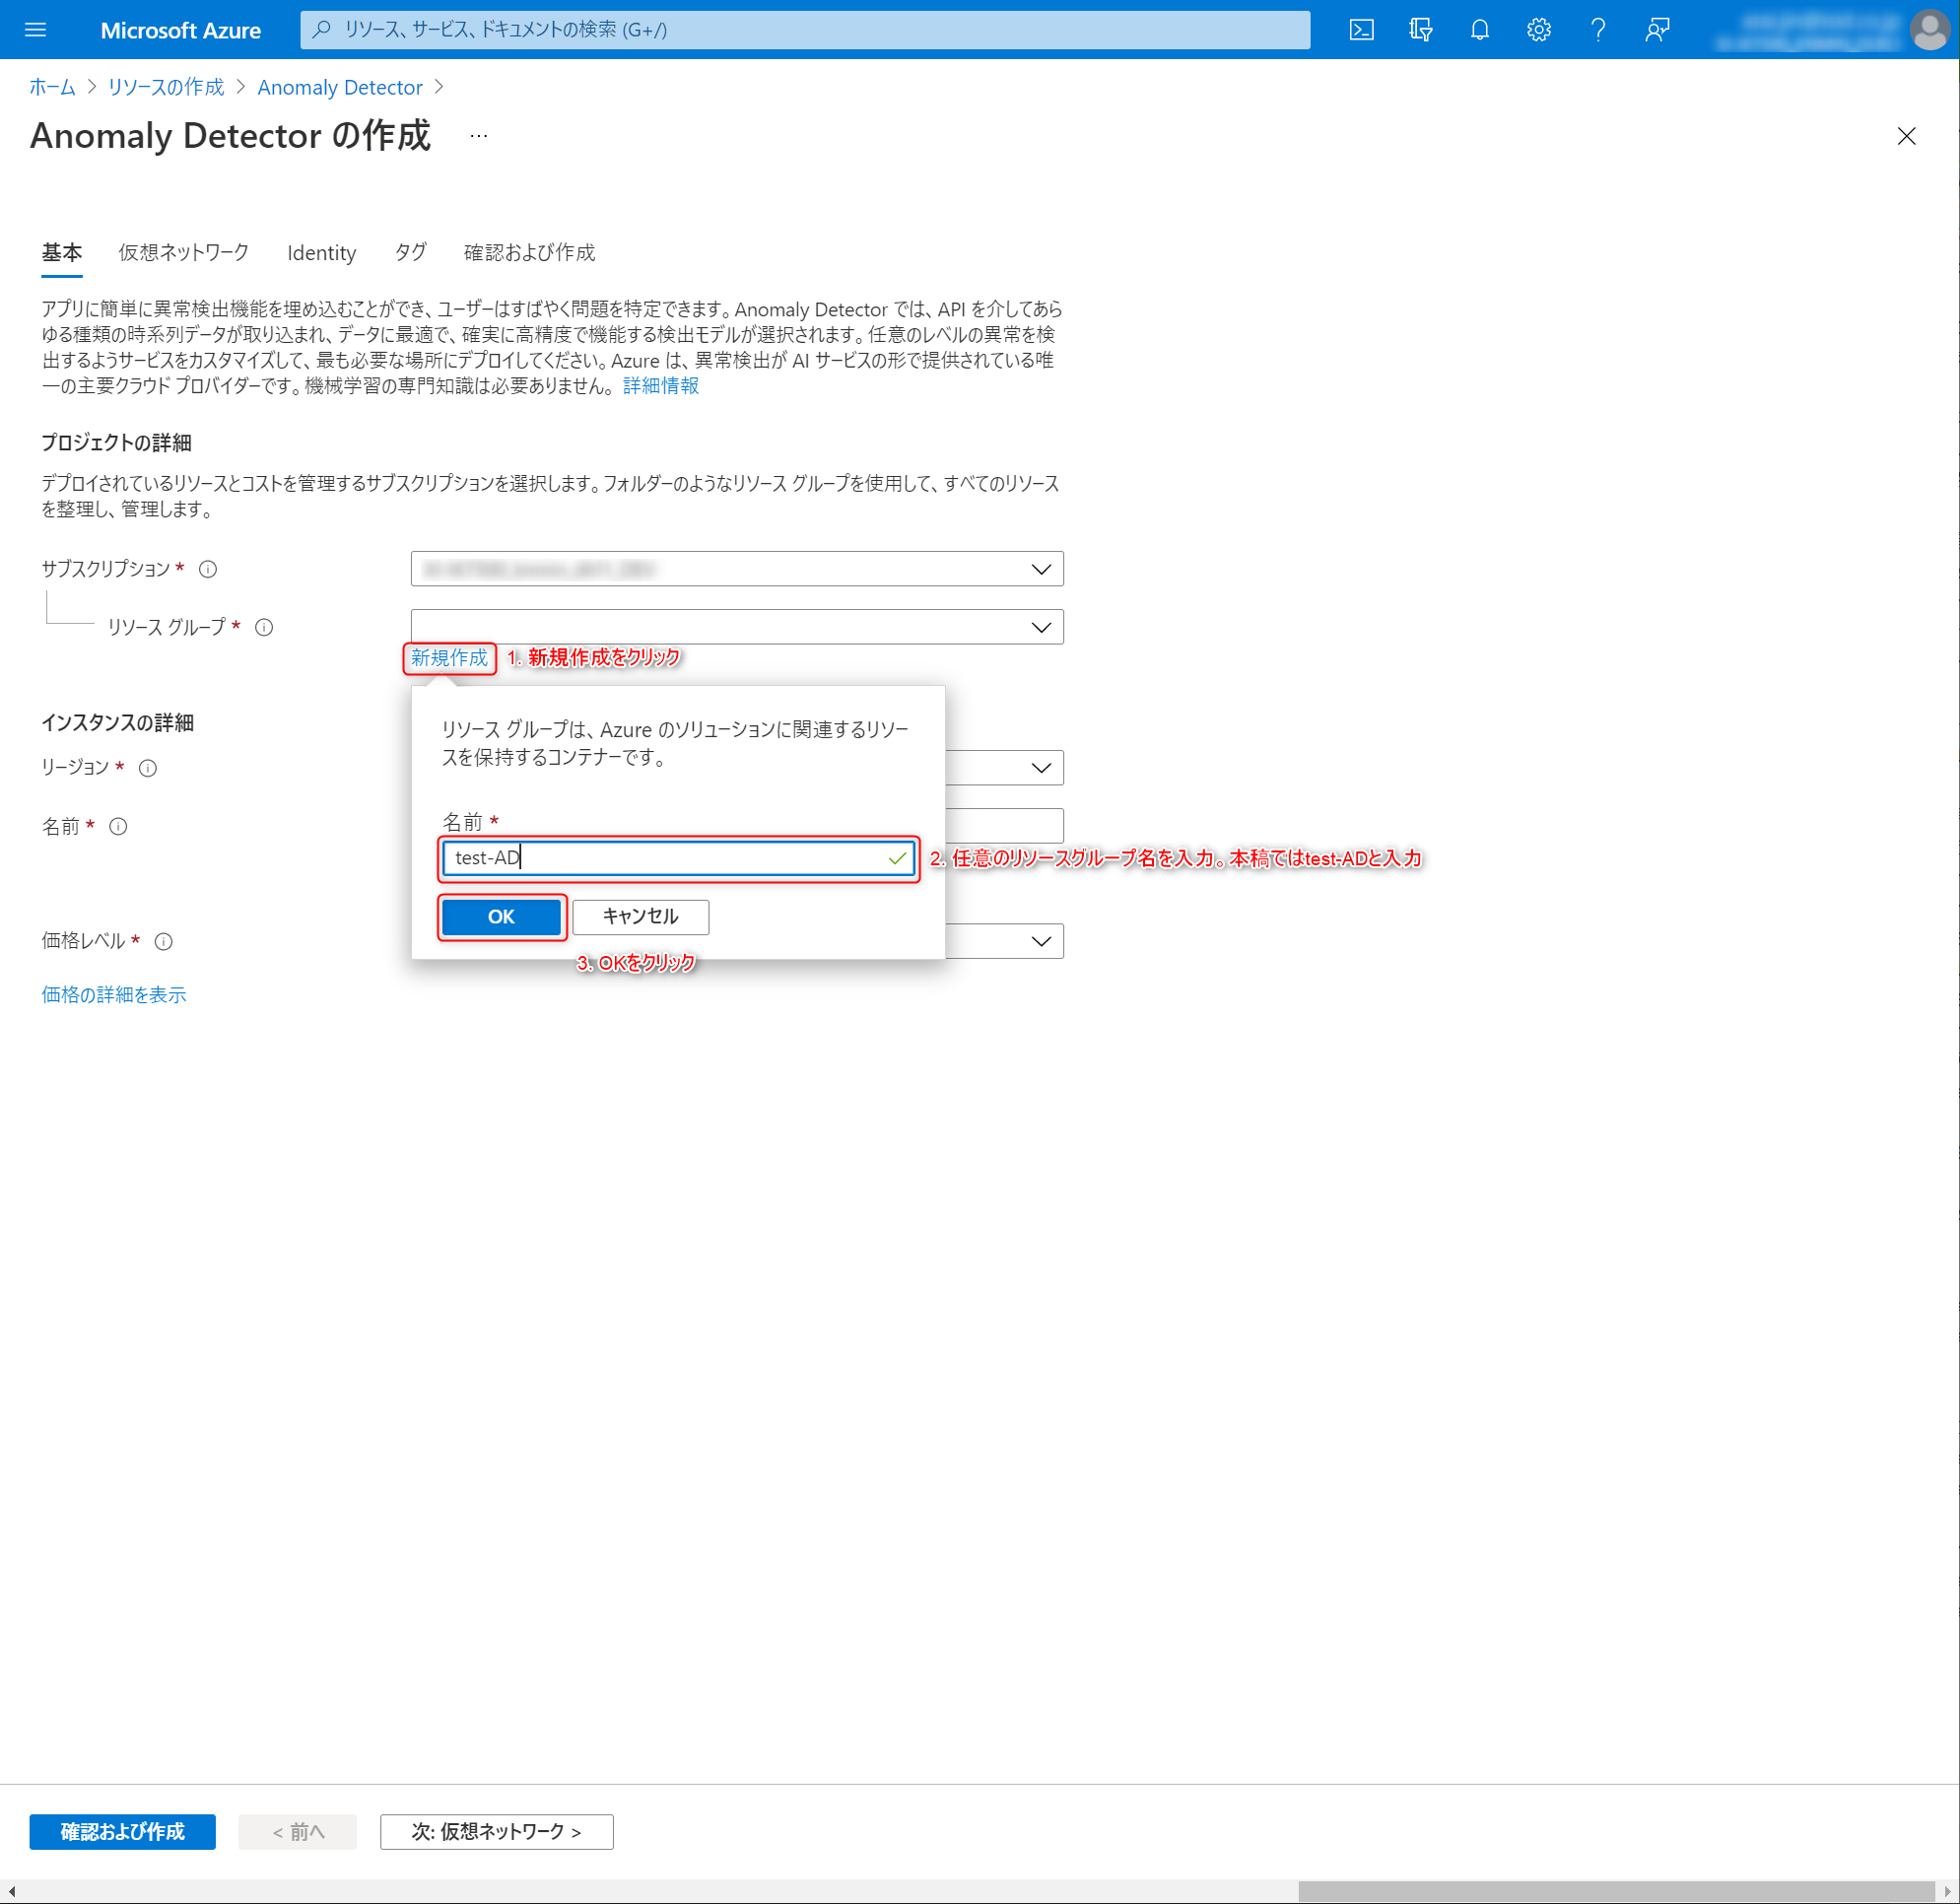
基本情報を入力していきます。まずはAnomaly Detectorリソースの作成先となるリソースグループを設定します。今回は機能テストなので、
test-ADというリソースグループを新規作成することにします。
-
インスタンスの詳細を設定していきます。
リージョン
多変量のAnomaly Detectorは現時点(2021.06)で米国西部 2、米国東部 2、西ヨーロッパの3つのみ対応しています。
ここでは米国西部 2を指定します。
名前
任意の名前を指定します。ここではtest-AD-202106を入力しています。
他者が使っている名前はエラーが出ます。なので私が使ったtest-AD-202106は利用できません。入力した名称で作成できなかった場合は適当な名前で作成してください。
価格レベル
Free F0を選択します。
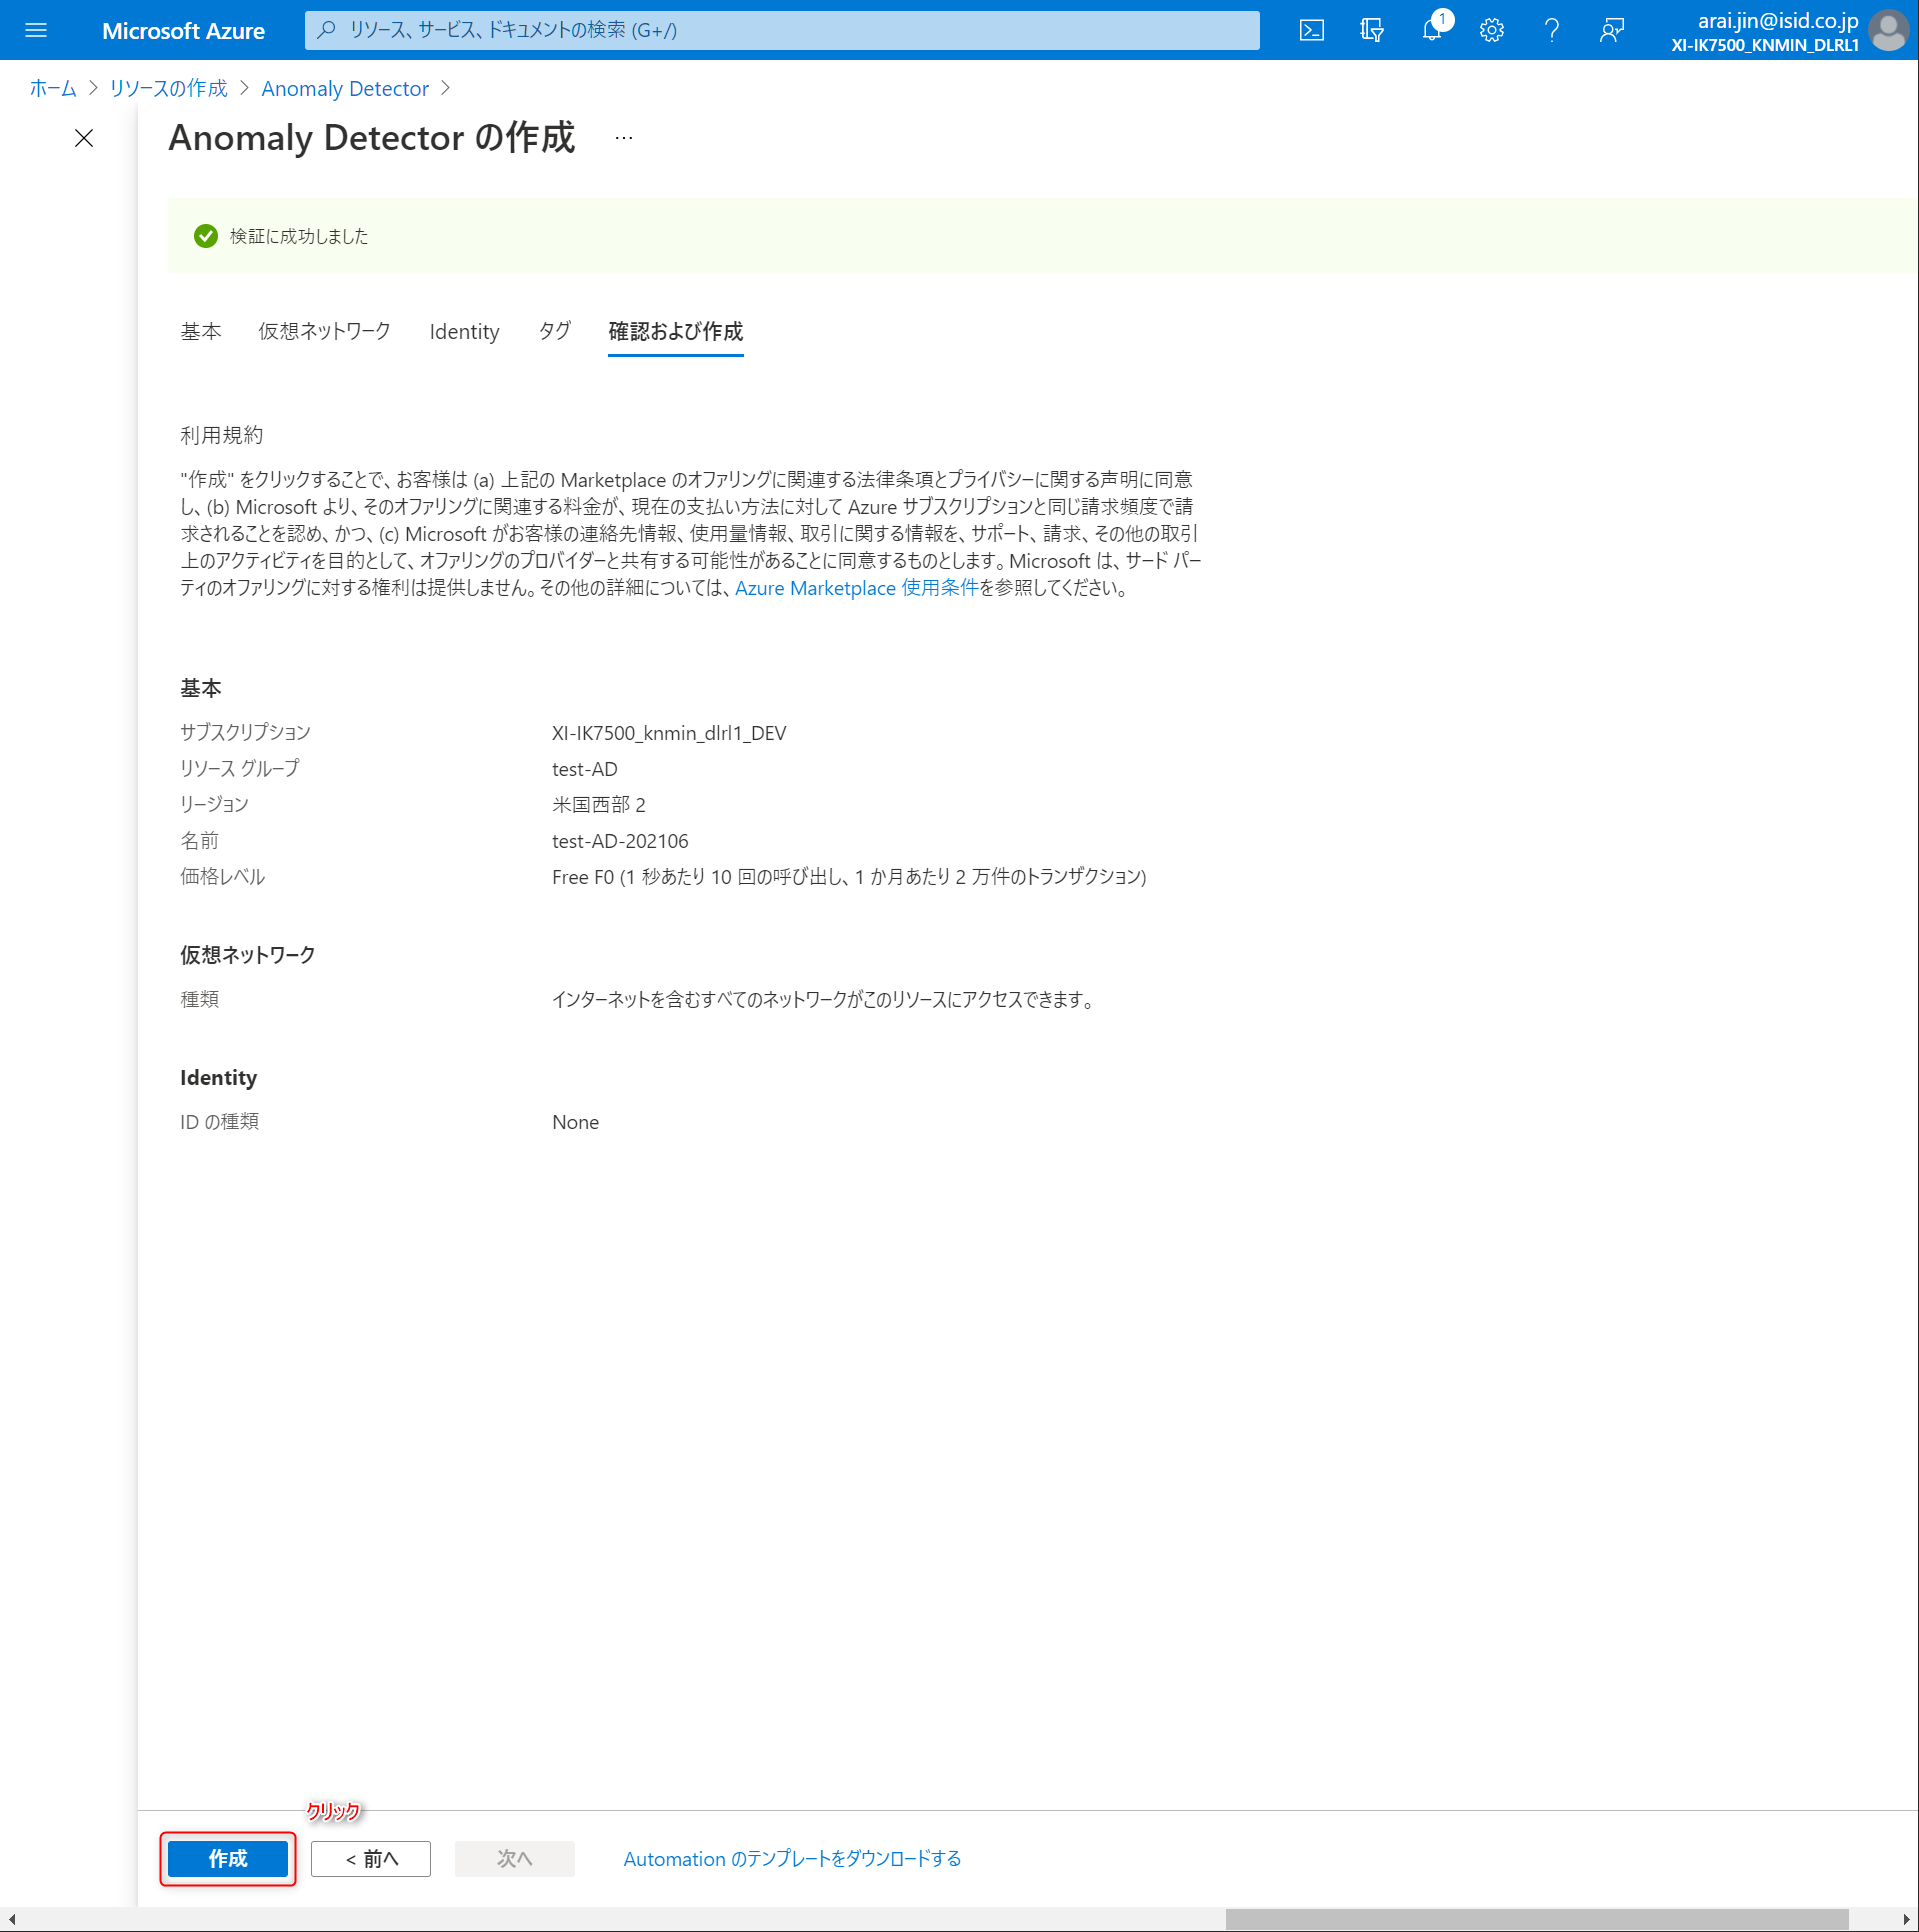
設定完了時のキャプチャ
3. サンプルデータの準備
kaggleよりポンプデータを拝借してきます。
このポンプデータには計測時刻、センサー値、その時点での機械状態(NORMAL、BROKEN、RECOVERING)が記録されています。
サンプルで動かすには少々データサイズが大きいため、このデータから一部を抽出してAnomaly Detectorを動かしていきます。
4. Anomaly Detector APIを用いた異常検知
Anomaly Detectorを利用する準備が整ったのでいよいよサービスに触れていきます。途中グラフなどを描写しながら実行しているため、Jupyter Notebookなど対話型実行環境での実行を推奨します。
こちらのコードをベースに学習、推論、結果の可視化を行っていきます。
1. 必要なパッケージをインストールします。
pip install azure-ai-anomalydetector msrest pandas matplotlib
2. 必要なパッケージをimportします。
最後のスタイル設定は私が好きなスタイルです。
デフォルト設定のmatplotlibのグラフは見にくいため変更してます。
import os
import time
import shutil
import pandas as pd
from glob import glob
from datetime import datetime

from azure.ai.anomalydetector import AnomalyDetectorClient
from azure.ai.anomalydetector.models import DetectionRequest, ModelInfo, AlignPolicy
from azure.core.credentials import AzureKeyCredential
from azure.core.exceptions import HttpResponseError

import matplotlib.pyplot as plt

%matplotlib inline

# グラフのスタイル設定
plt.style.use(['seaborn-talk', 'seaborn-darkgrid'])
3. Anomaly Detector操作用のクラスを定義
サンプルコードからそのまま引用しています。
class MultivariateSample():

    def __init__(self, subscription_key, anomaly_detector_endpoint, data_source=None):
        self.sub_key = subscription_key
        self.end_point = anomaly_detector_endpoint

        # Create an Anomaly Detector client

        # <client>
        self.ad_client = AnomalyDetectorClient(AzureKeyCredential(self.sub_key), self.end_point)
        # </client>

        if not data_source:
            # Datafeed for test only
            self.data_source = "YOUR_SAMPLE_ZIP_FILE_LOCATED_IN_AZURE_BLOB_STORAGE_WITH_SAS"
        else:
            self.data_source = data_source

    def train(self, start_time, end_time, max_tryout=500):

        # Number of models available now
        model_list = list(self.ad_client.list_multivariate_model(skip=0, top=10000))
        print("{:d} available models before training.".format(len(model_list)))

        # Use sample data to train the model
        print("Training new model...")
#         data_feed = ModelInfo(start_time=start_time, end_time=end_time, source=self.data_source, sliding_window=100, align_policy=AlignPolicy(align_mode='Inner', fill_na_method='Pad', padding_value=0))
        data_feed = ModelInfo(start_time=start_time, end_time=end_time, source=self.data_source)

        response_header = \
            self.ad_client.train_multivariate_model(data_feed, cls=lambda *args: [args[i] for i in range(len(args))])[-1]
        trained_model_id = response_header['Location'].split("/")[-1]

        # Model list after training
        new_model_list = list(self.ad_client.list_multivariate_model(skip=0, top=10000))

        # Wait until the model is ready. It usually takes several minutes
        model_status = None
        tryout_count = 0
        while (tryout_count < max_tryout and model_status != "READY"):
            model_status = self.ad_client.get_multivariate_model(trained_model_id).model_info.status
            tryout_count += 1
            time.sleep(2)

        assert model_status == "READY"

        print("Done.", "\n--------------------")
        print("{:d} available models after training.".format(len(new_model_list)))

        # Return the latest model id
        return trained_model_id


    def detect(self, model_id, start_time, end_time, max_tryout=500):

        # Detect anomaly in the same data source (but a different interval)
        try:
            detection_req = DetectionRequest(source=self.data_source, start_time=start_time, end_time=end_time)
            response_header = self.ad_client.detect_anomaly(model_id, detection_req,
                                                            cls=lambda *args: [args[i] for i in range(len(args))])[-1]
            result_id = response_header['Location'].split("/")[-1]

            # Get results (may need a few seconds)
            r = self.ad_client.get_detection_result(result_id)
            tryout_count = 0
            while r.summary.status != "READY" and tryout_count < max_tryout:
                time.sleep(1)
                r = self.ad_client.get_detection_result(result_id)
                tryout_count += 1

            if r.summary.status != "READY":
                print("Request timeout after %d tryouts.".format(max_tryout))
                return None

        except HttpResponseError as e:
            print('Error code: {}'.format(e.error.code), 'Error message: {}'.format(e.error.message))
        except Exception as e:
            raise e

        return r

    def export_model(self, model_id, model_path="model.zip"):

        # Export the model
        model_stream_generator = self.ad_client.export_model(model_id)
        with open(model_path, "wb") as f_obj:
            while True:
                try:
                    f_obj.write(next(model_stream_generator))
                except StopIteration:
                    break
                except Exception as e:
                    raise e

    def delete_model(self, model_id):

        # Delete the mdoel
        self.ad_client.delete_multivariate_model(model_id)
        model_list_after_delete = list(self.ad_client.list_multivariate_model(skip=0, top=10000))
        print("{:d} available models after deletion.".format(len(model_list_after_delete)))
4. 学習データの準備
今回はお試しなので、センサーデータは00~04までの5つ、データ期間は2018-04-01~2018-05-20に絞っています。
Anomaly Detectorへの入力は少々特殊で、以下入力仕様に沿って作る必要があります。
入力仕様
-
timestampとvalueの2つの列のみを含むCSVファイルにする -
timestampの値は、ISO8601に準拠している - 各CSVファイルには、変数に基づいて異なる名前を付ける必要がある。
たとえば、temperature.csvやhumidity.csvなど - すべてのCSVファイルは、サブフォルダーを使用しないで1つのZIPファイルに圧縮する必要がある
- 詳しくはこちらのドキュメントに記載されています。
入力仕様に基づきポンプデータを加工するスクリプトは以下になります。
# ポンプデータ読み込み
df = pd.read_csv('./sensor.csv')

# timestamp列をISO8601表記に変換
df['timestamp'] = pd.to_datetime(df['timestamp']).dt.strftime('%Y-%m-%dT%H:%M:%S%z')

# サンプルなので、センサーデータはsensor_00からsensor_04までを利用
df = df[['timestamp', 'sensor_00', 'sensor_01', 'sensor_02', 'sensor_03', 'sensor_04', 'machine_status']]

# サンプルなので、期間は2018-04-01~2018-05-20に絞る
df = df[(df['timestamp'] >= '2018-04-01T00:00:00') & (df['timestamp'] < '2018-05-21T00:00:00')]

# Anomaly Detectorの入力仕様に合わせてCSVを分割出力
os.makedirs('train_data', exist_ok=True)

for col in ['sensor_00', 'sensor_01', 'sensor_02', 'sensor_03', 'sensor_04']:
    temp_df = df[['timestamp'] + [col]]
    temp_df.columns = ['timestamp', 'value']
    temp_df.to_csv(f'train_data/{col}.csv', index=None)

# ZIPファイルに固める
shutil.make_archive('./train_data', 'zip', root_dir='./train_data')
5. 学習データのアップロード
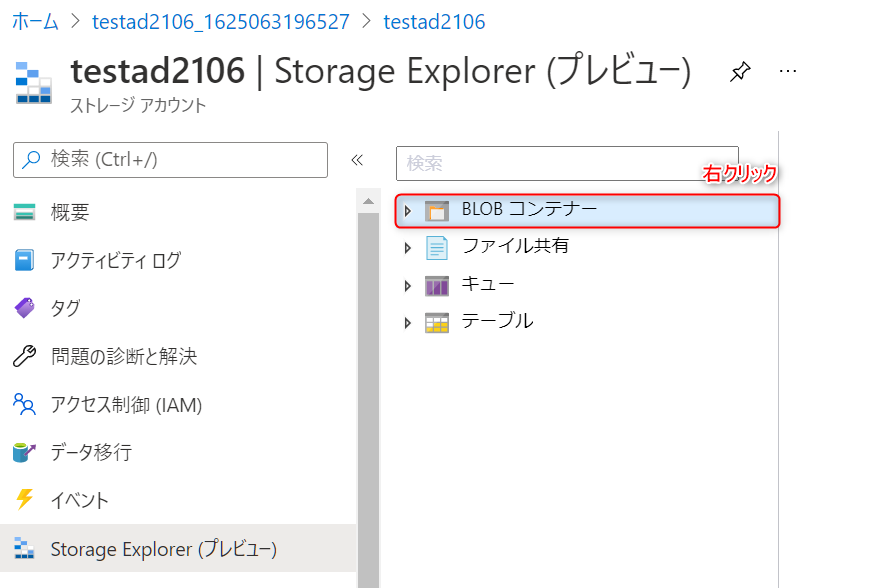
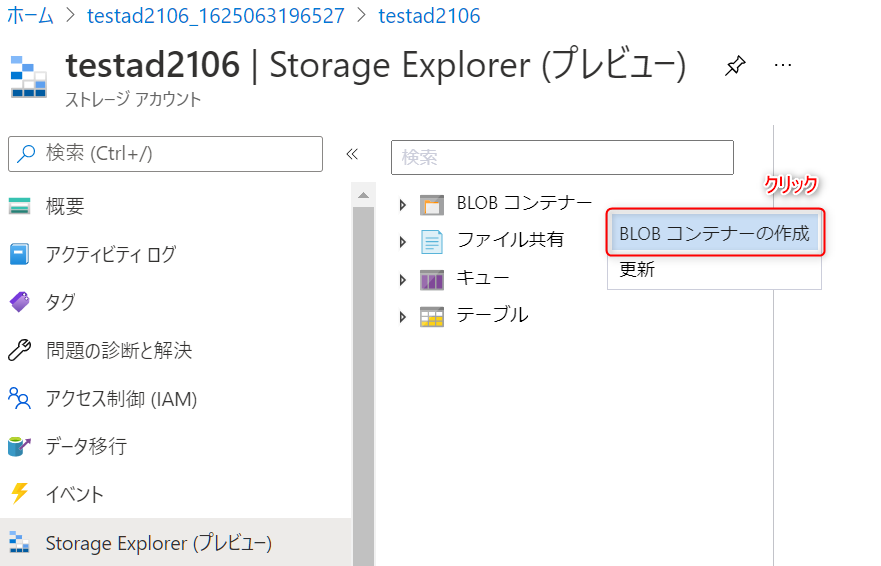
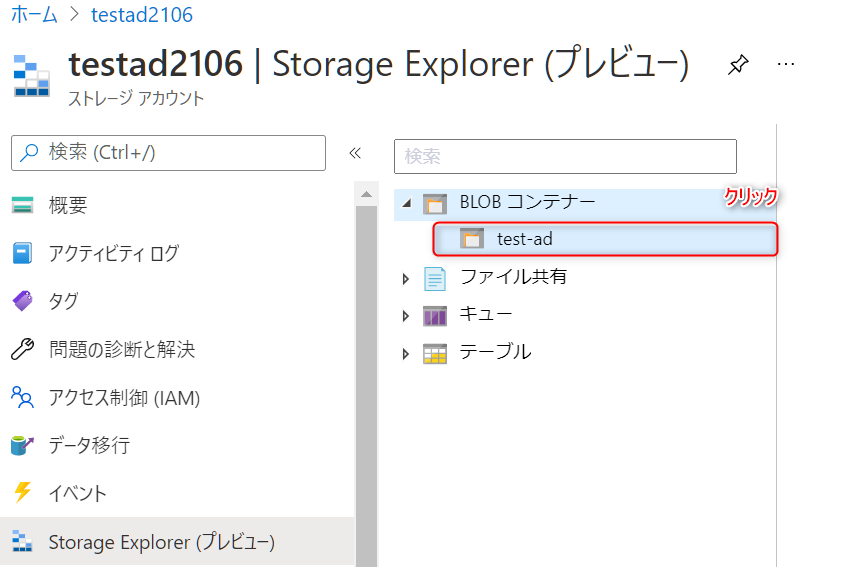
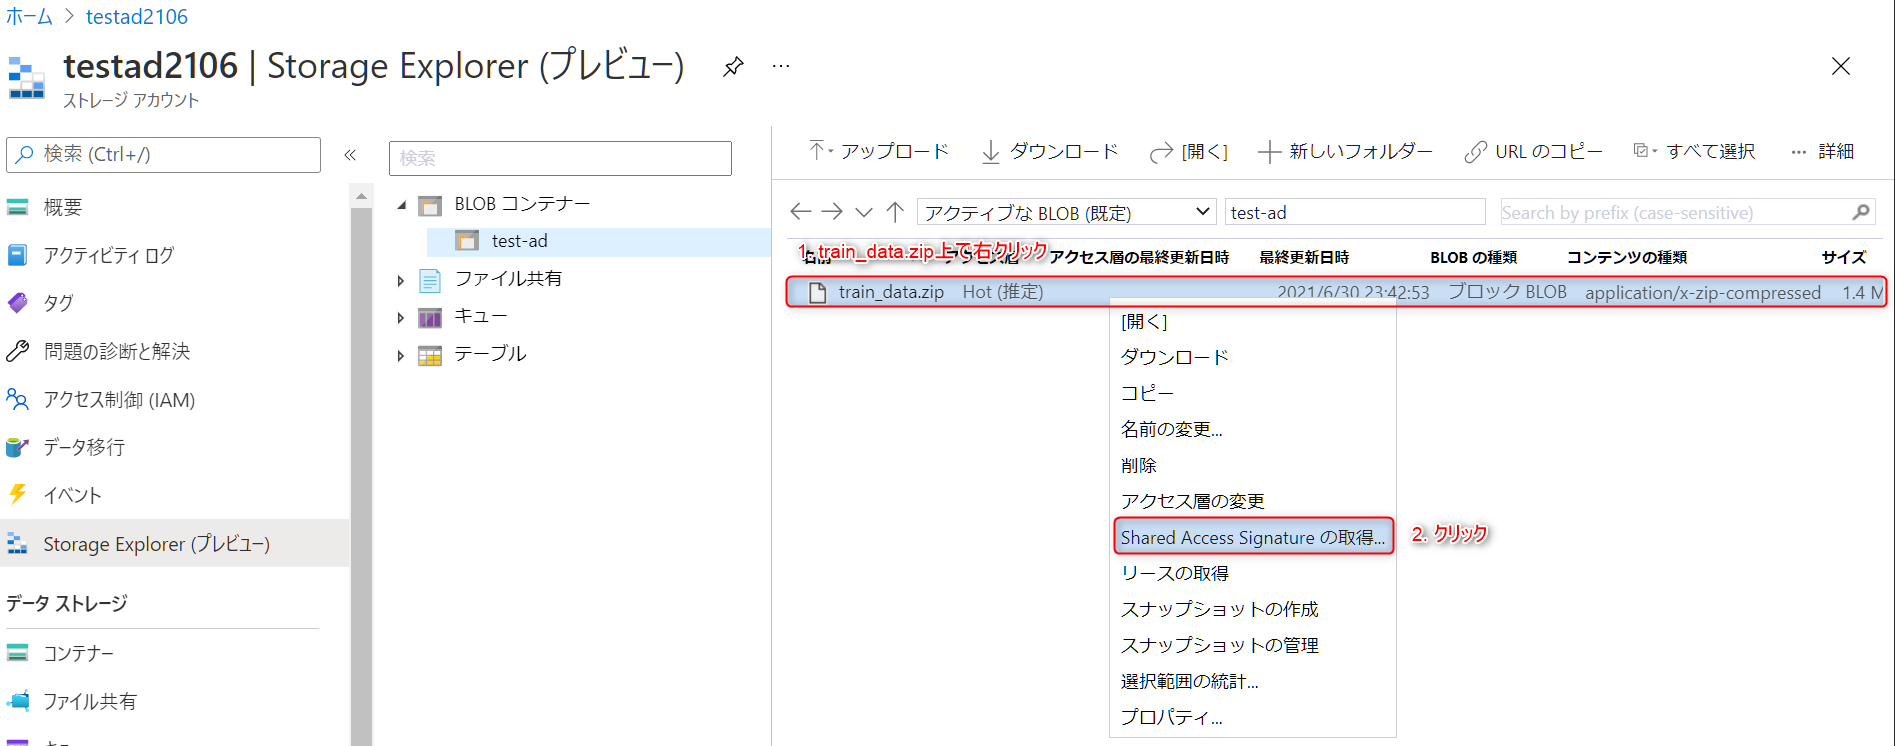
Anomaly Detectorに読み込ませるためには、先程作成したZIPファイルをAzure Blob Storageにアップロードし、そのZIPファイルのBLOB SAS(Shared Access Signature)URL を生成する必要があります。
Azure Blob Storageの作成方法がわからない方はこちらを参考にご準備ください。
-
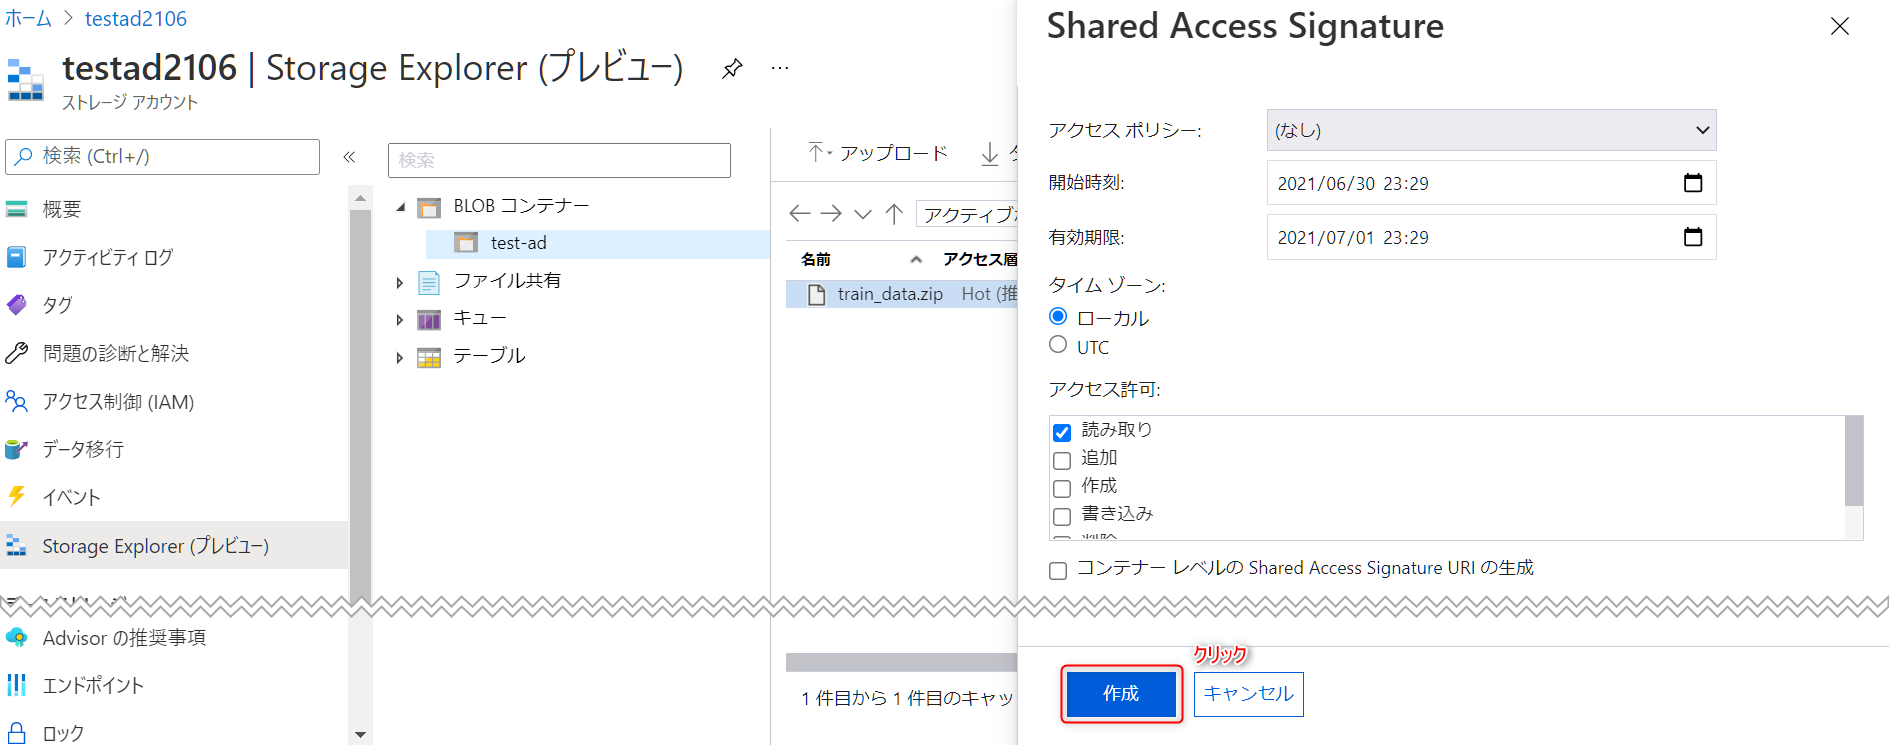
右側に
Shared Access Signatureというウィンドウが表示されるので、デフォルト設定のまま作成ボタンをクリックします。
-
アクセス権の情報が付与されたURIが発行されるので、
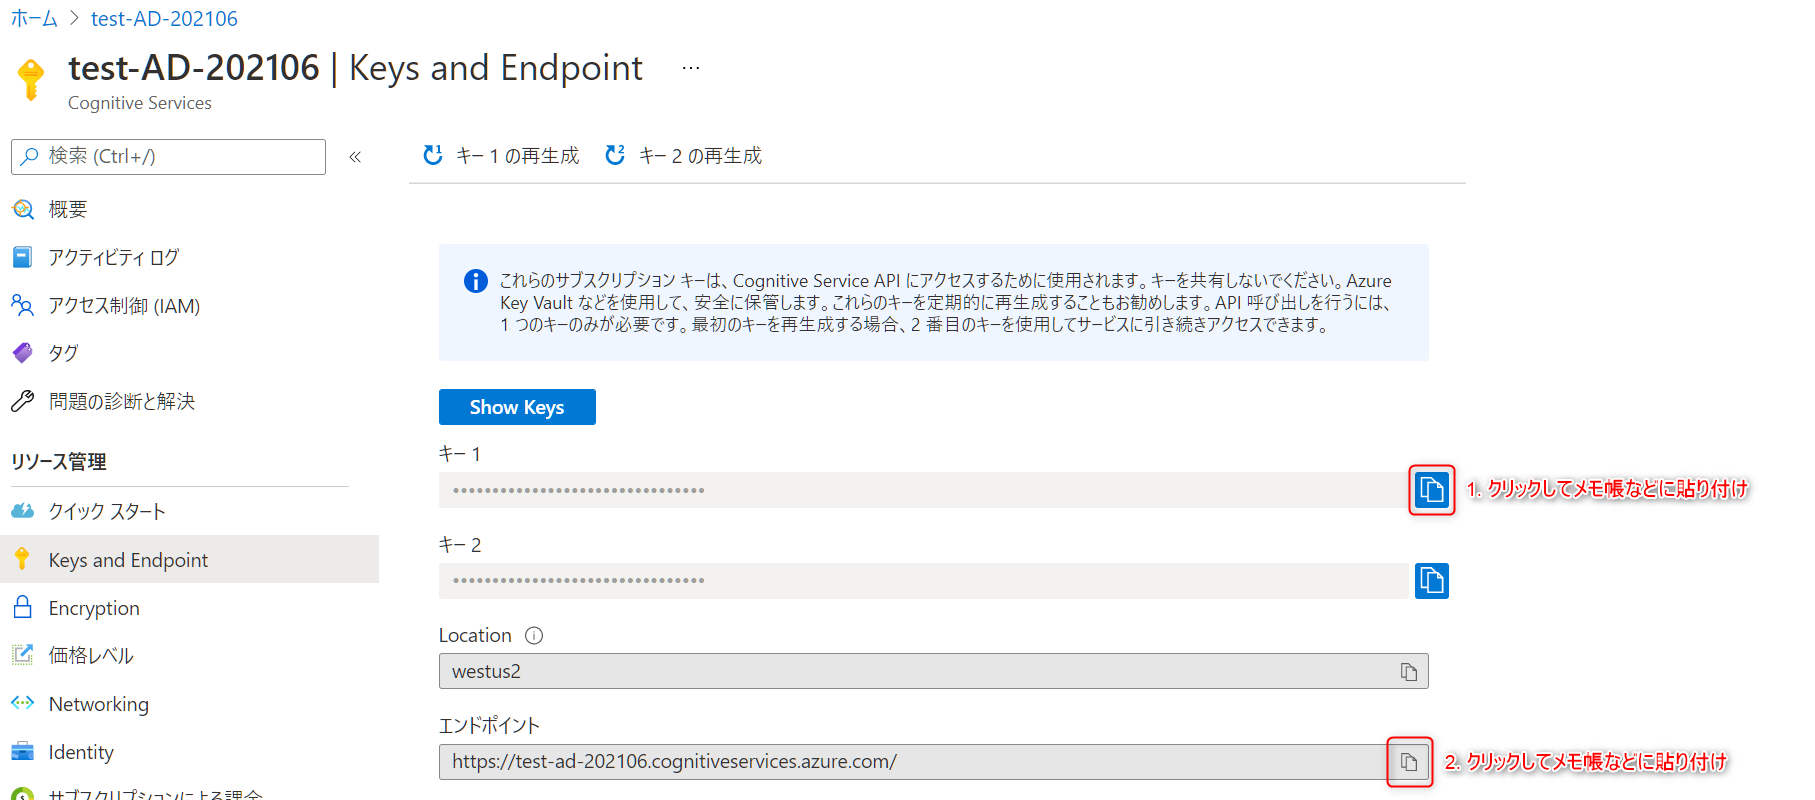
コピーボタンでコピーし、メモ帳などに貼り付けてください。このURIは後で使用します。

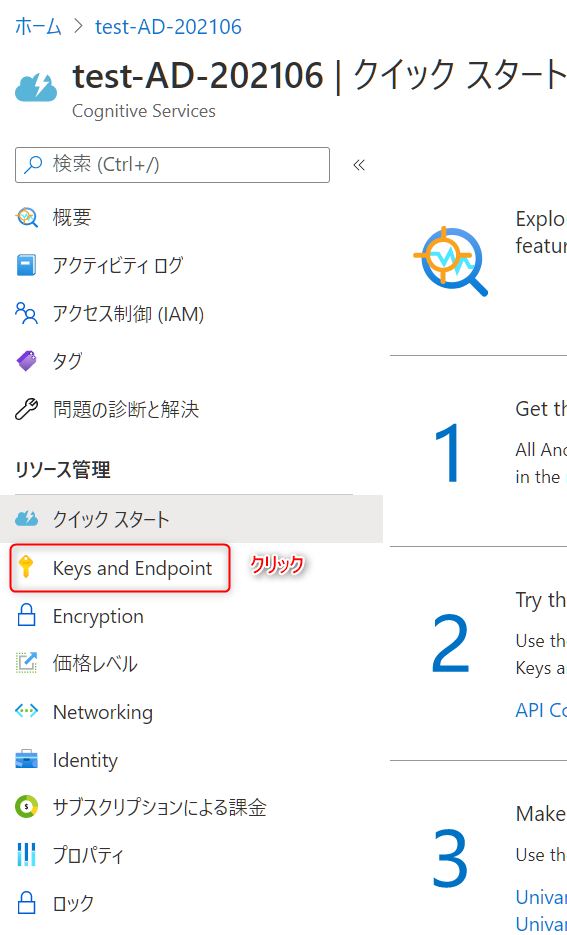
6. Anomaly Detectorとアップロードしたデータへのアクセス情報の設定
メモ帳などに貼り付けておいた情報を各変数に格納します。
# Anomaly Detectorのキー及びエンドポイント
subscription_key = "xxxxxxxxxxxxxxxxxxxxxxxxxxxxxxxx"
anomaly_detector_endpoint = "https://test-ad-202106.cognitiveservices.azure.com/"

# BLOB SASのURI
data_source = "https://testad2106.blob.core.windows.net/test-ad/train_data.zip?sp=rl&st=2021-06-30T14:29:59Z&se=2021-07-01T14:29:59Z&sv=2020-02-10&sr=b&sig=xxxxxxxxxxxxxxxxxxxxxxxxxxxxxxxxxxxxxxxxxxxxxx"
7. Anomaly Detector操作用クライアントを生成し学習開始
先程定義したクラスを用いてAnomaly Detector操作用クライアントを生成します。
その後、学習データとして2018-04-01~2018-05-20(全期間)を指定し、学習を開始します。
# Anomaly Detector操作用クライアント生成
sample = MultivariateSample(subscription_key, anomaly_detector_endpoint, data_source=data_source)

# 学習開始
model_id = sample.train(datetime(2018, 4, 1, 0, 0, 0), datetime(2018, 5, 20, 0, 0, 0))
学習はしばらく時間がかかるため、終了するまで待ちます。
学習が完了すると以下のようにDone.と表示されます。

8. 学習モデルを用いて推論
Anomaly Detector操作用クライアントを用いて、2018-05-10~2018-05-20の推論を行い、この期間のどのタイミングで異常が生じたかを判定します。
# 推論
result = sample.detect(model_id, datetime(2018, 5, 10, 0, 0, 0), datetime(2018, 5, 20, 0, 0, 0))

# 異常値検知結果を取得しデータフレーム化
detected = []
for res in result.results:
    detected.append([res.timestamp, res.value.is_anomaly, res.value.score])

detected_df = pd.DataFrame(detected, columns=['timestamp', 'is_anomaly', 'value'])
detected_df['timestamp'] = pd.to_datetime(detected_df['timestamp']).dt.strftime('%Y-%m-%dT%H:%M:%S')
9. 判定結果を可視化して確認
以下スクリプトを実行すると、推論結果が描写されます。
異常である可能性が少しでもあると異常と判断されてしまうため、異常である自信度が一定上ある(本稿では0.2を指定)ものを真の異常として結果を出力しています。
機械学習の特性上、学習結果に再現性はありませんので、皆様の手元で実施した結果と本稿の結果が一致しない可能性があることにご注意ください。
# 異常値検知結果と元データを紐付ける
result_df = pd.merge(df, detected_df, how='left', on='timestamp')

# 描写用に推論した時間のみに絞る
plot_df = result_df[~result_df['value'].isnull()].reset_index(drop=True)

# 異常である自信度が0.2より大きいものを選択(出力の調整)
plot_df['is_anomaly'] = plot_df['value'].apply(lambda x: True if x>0.2 else False)

# 結果の可視化
plot_df[['sensor_00', 'sensor_01', 'sensor_02', 'sensor_03', 'sensor_04', 'value']].plot(subplots=True, legend=True, figsize=(16, 16), color='darkcyan')

for detected_time in list(plot_df[plot_df['is_anomaly'] == True].index):
    for i, ax in enumerate(plt.gcf().axes):
        ax.axvspan(detected_time, detected_time, color = "red", alpha=0.8)
plt.show()
下図のような結果が得られます。
後半部分が異常と判断されており、確かに5つのセンサーデータの挙動に変化が見られます。
一番下のvalueというグラフは、異常である自信度の値を示しています。
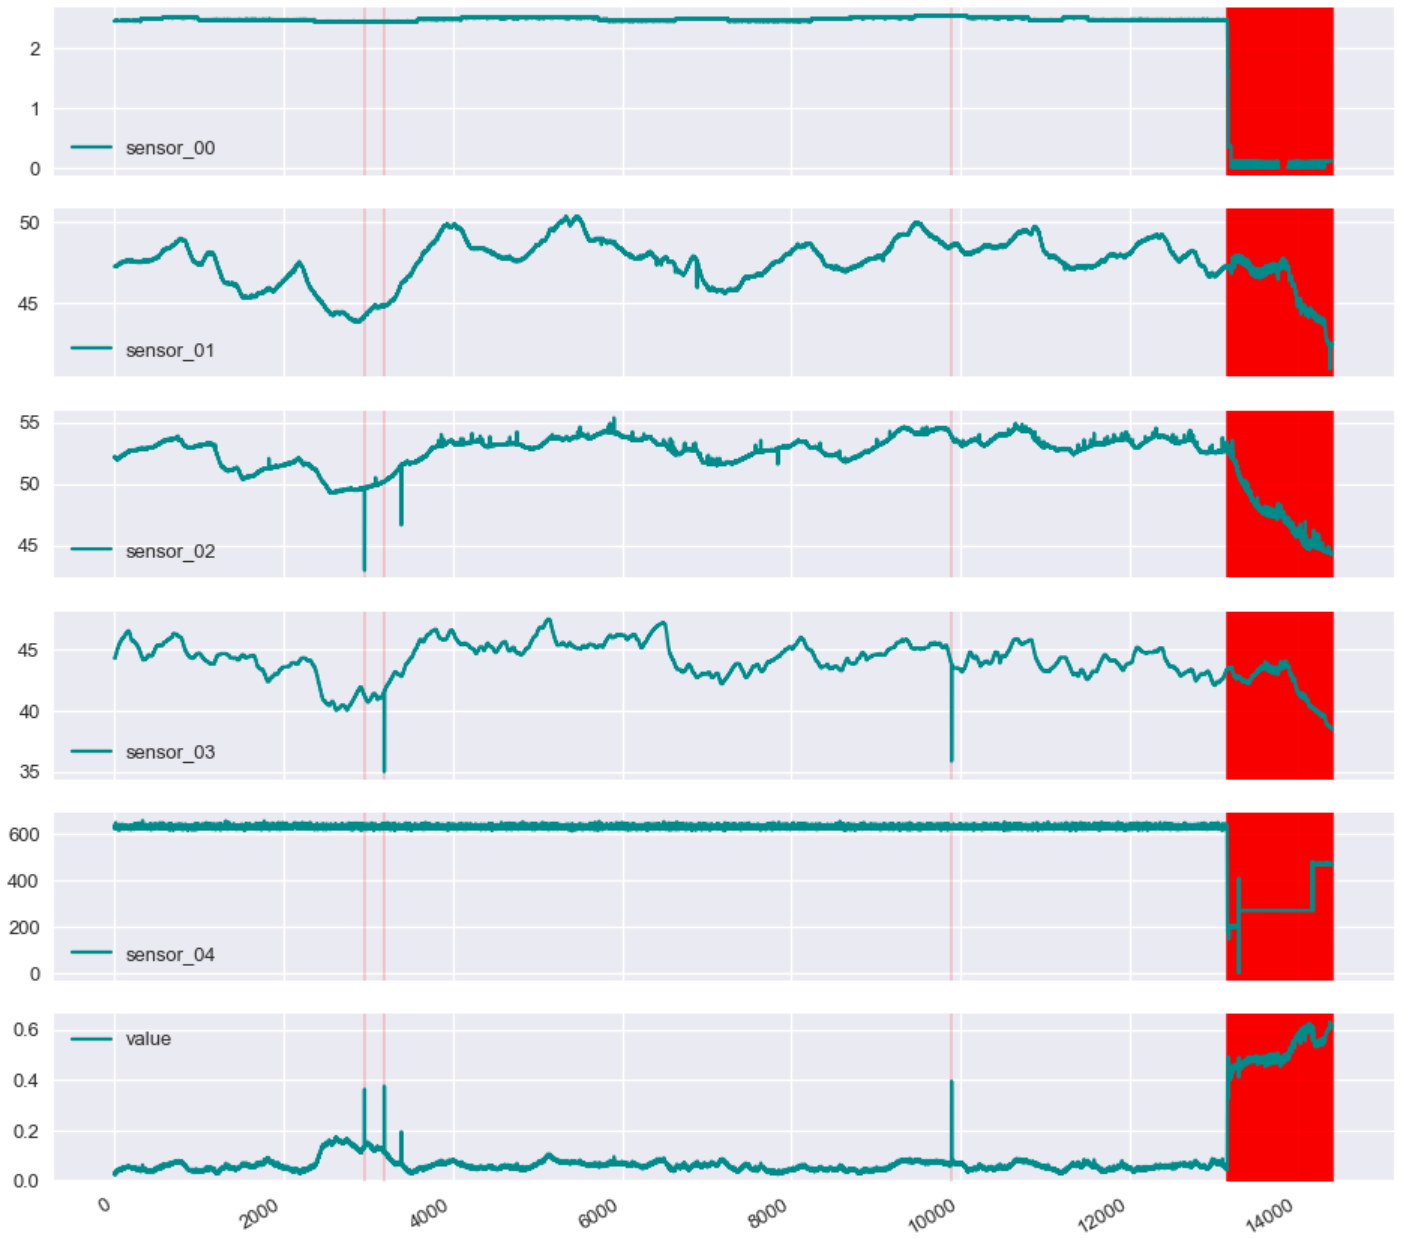
今回使用したポンプデータには、その時の機械の状態が記録されているので、異常だと判断された後半の時間帯に何が起きていたのかを確認します。
plt.figure(figsize=(16, 2))
plt.plot(plot_df['machine_status'])
plt.show()
Anomaly Detectorが異常であると判断した時間帯はRECOVERING(保守中)であったことがわかりました。学習時にこの情報は与えていませんが、データ特性の違いから的確に状態が変化した部分を検知できていることがわかります。
まとめ
今回は、AzureのAnomaly Detectionの有用性を実際のスクリプトを交えご紹介しました。
2021年6月時点ではPublic Previewとなっており、一般提供が開始(General Availability)されるまでは少し時間がかかりそうです。GAとなるのが待ち遠しい機能です。
今回は紹介していませんが、欠損値補完、スライディングウィンドウ、データ間のサンプリング間隔を吸収するような機能も持っており、時系列データの扱いが非常に容易に行えるのも魅力の一つです。
ただ少し残念な点、改善して欲しい点はいくつかあります。
- Anomaly Detector側で前処理したデータを取得する術がない
- どの変数に反応しているのかがわからない
- 日本リージョンではまだ使えない
今のままでも十分活用できますが、これらが実装されれば異常検知はAnomaly Detectorを使っておけば間違いない、と言っても過言ではないサービスになると感じています。
個人で異常検知を行おうとすると、難しいアルゴリズムを実装する必要がありますが、Anomaly Detectorを使うことで容易に行うことができます。
本稿を参考に是非一度お試しいただければと思います。
本稿が少しでも皆様のお役になれば幸いです。

