の演習問題を解いているが解答が本書内にもネット上にもない模様。自分の解答を晒して間違いにツッコミをいただき理解を深めようという試み。
- 問9.1
\begin{align}
\begin{bmatrix}
0.9 & 0    & 0.05 \\
0.1 & 0.95 & 0 \\
0   & 0.05 & 0.92 \\
\end{bmatrix}
\begin{bmatrix}
x_{t_1} \\
x_{t_2} \\
x_{t_3} \\
\end{bmatrix}
&=
\begin{bmatrix}
x_{(t+1)_1} \\
x_{(t+1)_2} \\
x_{(t+1)_3} \\
\end{bmatrix} \\
x_{(t+1)_1}&=0.9x_{t_1}\quad\quad\quad+0.05x_{t_3} \\
x_{(t+1)_2}&=0.1x_{t_1}+0.95x_{t_2} \\
x_{(t+1)_3}&=\quad\quad\quad0.05x_{t_2}+0.95x_{t_3} \\
\end{align}
- 問9.2
- (a) セクター3のt期がセクター2のt+1期の産出量に及ぼす影響の度合い。
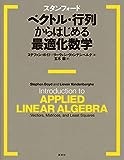
- (b)
import numpy as np
import matplotlib.pyplot as plt

a = np.array([0.6, 0.9, 1.3, 0.5])
B = np.array([[0.1, 0.06, 0.05, 0.70], [0.48, 0.44, 0.1, 0.04], [0.0, 0.55, 0.52, 0.04], [0.04, 0.01, 0.42, 0.51]])

sum_a = []
sum_a.append(sum(a))
for i in range(1, 20):
  a = B @ a
  sum_a.append(sum(a))

plt.figure(figsize=(12, 6))
plt.plot(list(range(1, 21)), sum_a)

plt.xlabel('time')
plt.ylabel('sum_a')
plt.show()
- 問9.3
\begin{align}
(I-A)z&=c \\
z&=(I-A)^{-1}c \\
また、\\
Fz&=g \\
z&=F^{-1}g \\
より、\\
F&=I-A\\
g&=c
\end{align}
- 問9.4
\begin{align}
x_{t+1}&=A_1x_t+A_2x_{t-1} \\
z_t&=
\begin{bmatrix}
x_t \\
x_{t-1} \\
\end{bmatrix}\\
z_{t+1}&=
\begin{bmatrix}
x_{t+1} \\
x_t \\
\end{bmatrix}\\
&=
\begin{bmatrix}
A_1 & A_2 \\
1   & 0 \\
\end{bmatrix}
\begin{bmatrix}
x_t \\
x_{t-1} \\
\end{bmatrix}\\
よって、B&=
\begin{bmatrix}
A_1 & 0 \\
0   & A_2 \\
\end{bmatrix}となるBを考えれば\\
z_{t+1}&=Bz_tとなる。
\end{align}
- 問9.5
\begin{align}
問9.4より、\\
x_{t+1}&=A_1x_t+A_2x_{t-1}\\
z_t&=(x_t, x_{t-1}) \\
\iff z_{t+1}&=Bz_t\\
y_{t+1}&=y_t+y_{t-1} \\
x_t&=(y_t, y_{t-1}) \\
x_{t+1}&=Bx_t \\
B&=\begin{bmatrix}
1 & 1 \\
1 & 0 \\
\end{bmatrix}
\end{align}
import numpy as np

x = np.array([0, 1])
B = np.array([[1, 1], [1, 0]])
print(x[0])
for i in range(20):
  x = B @ x
  print(x[0])
0
1
1
2
3
5
8
13
21
34
55
89
144
233
377
610
987
1597
2584
4181
6765
- 修正フィボナッチ数列
\begin{bmatrix}
z_t \\
z_{t-1} \\
\end{bmatrix}
=
\begin{bmatrix}
1 & -1 \\
1 & 0 \\
\end{bmatrix}
\begin{bmatrix}
z_{t-1} \\
z_{t-2} \\
\end{bmatrix}
import numpy as np

z = np.array([0, 1])
B = np.array([[1, -1], [1, 0]])
print(z[0])
for i in range(20):
  z = B @ z
  print(z[0])
0
-1
-1
0
1
1
0
-1
-1
0
1
1
0
-1
-1
0
1
1
0
-1
-1
- 問9.6
\begin{align}
x_t&=\frac{u_1+u_2+\cdots+u_{t-1}}{t-1} \\
x_{t+1}&=\frac{u_1+u_2+\cdots+u_{t-1}+u_t}{t} \\
&=\frac{t-1}{t}\left(\frac{u_1+u_2+\cdots+u_{t-1}}{t-1}+\frac{u_t}{t-1}\right) \\
&=\frac{t-1}{t}\left(x_t+\frac{u_t}*{t-1}\right) \\
&=\frac{t-1}{t}x_t+\frac{u_t}{t}

\end{align}
- 問9.7
X_{t+1}=AX_t+Bu_t \\
t 1単位につき、計算量は\\
(n+(n-1))\times n \\
(m+(m-1))\times m \\
(2n-1)n+(2m-1)m \\
が10^5回あるから\\
{(2\times15-1)\times 15+(2\times 5 - 0.5)}\times10^5 \\
4.85\times10^7 \\
\frac{4.85\times10^7}{10^9}=4.85\times10^{-2}s