自分が作っているR/BioconductorパッケージscTensorでは、1細胞RNA-Seqデータ内に含まれるリガンド・受容体の遺伝子発現を各々、赤・青色でプロットしている。
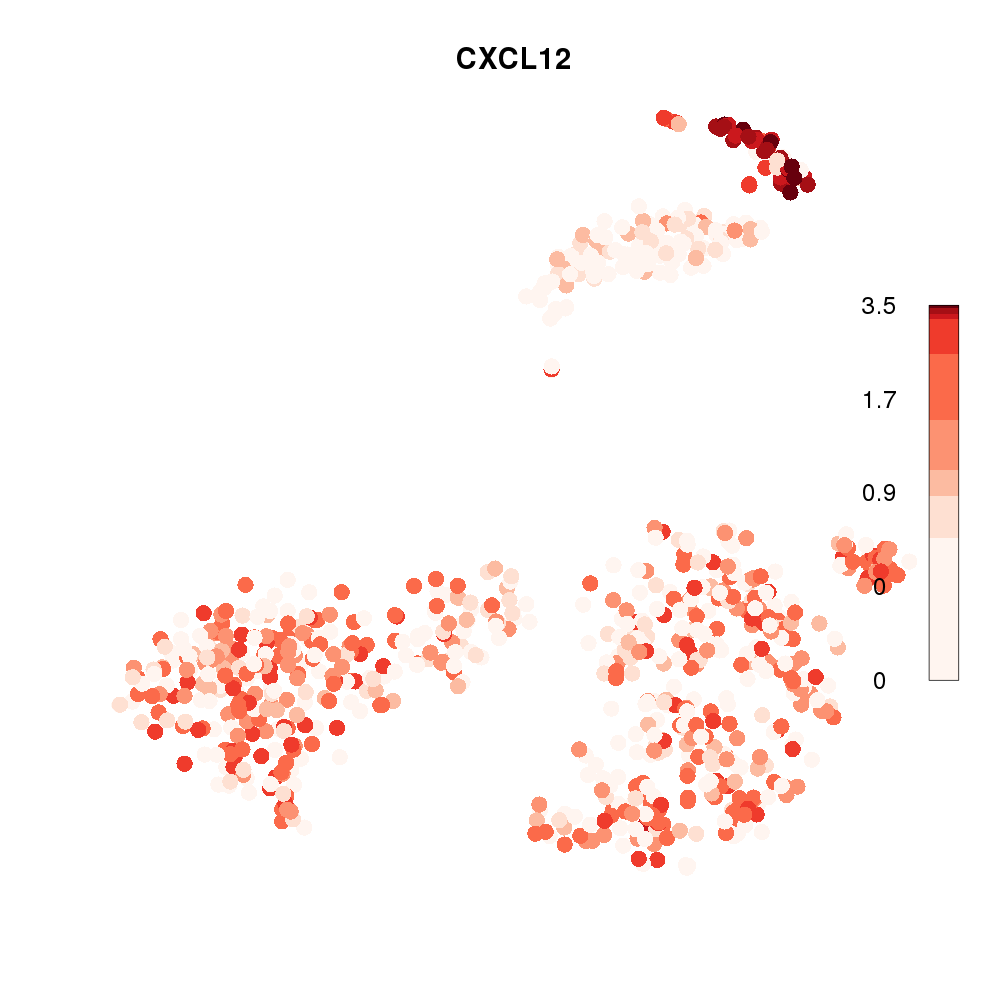
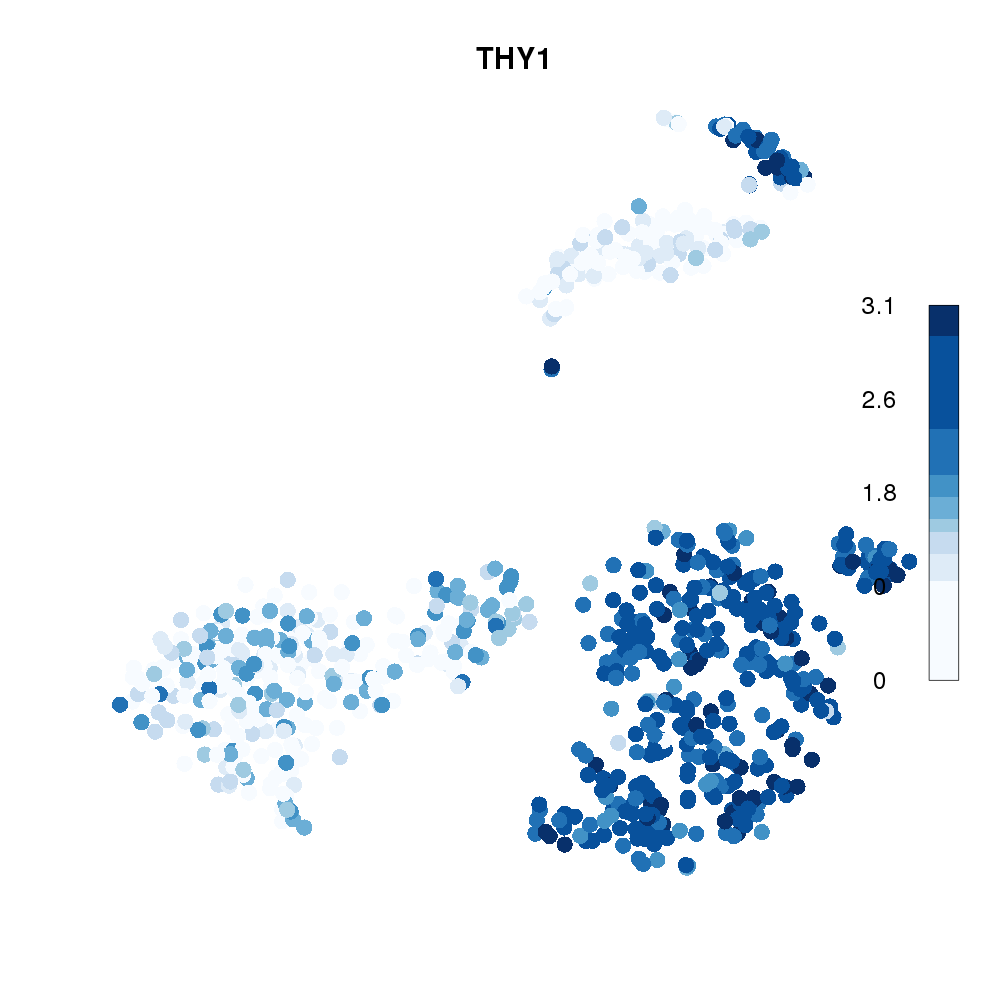
このように細胞1つ1つをプロットする場合に問題となるのは、点が重なるにつれて、裏側に隠れてしまい見えなくなる細胞が出てきてしまうことである(https://github.com/SaskiaFreytag/schex )。
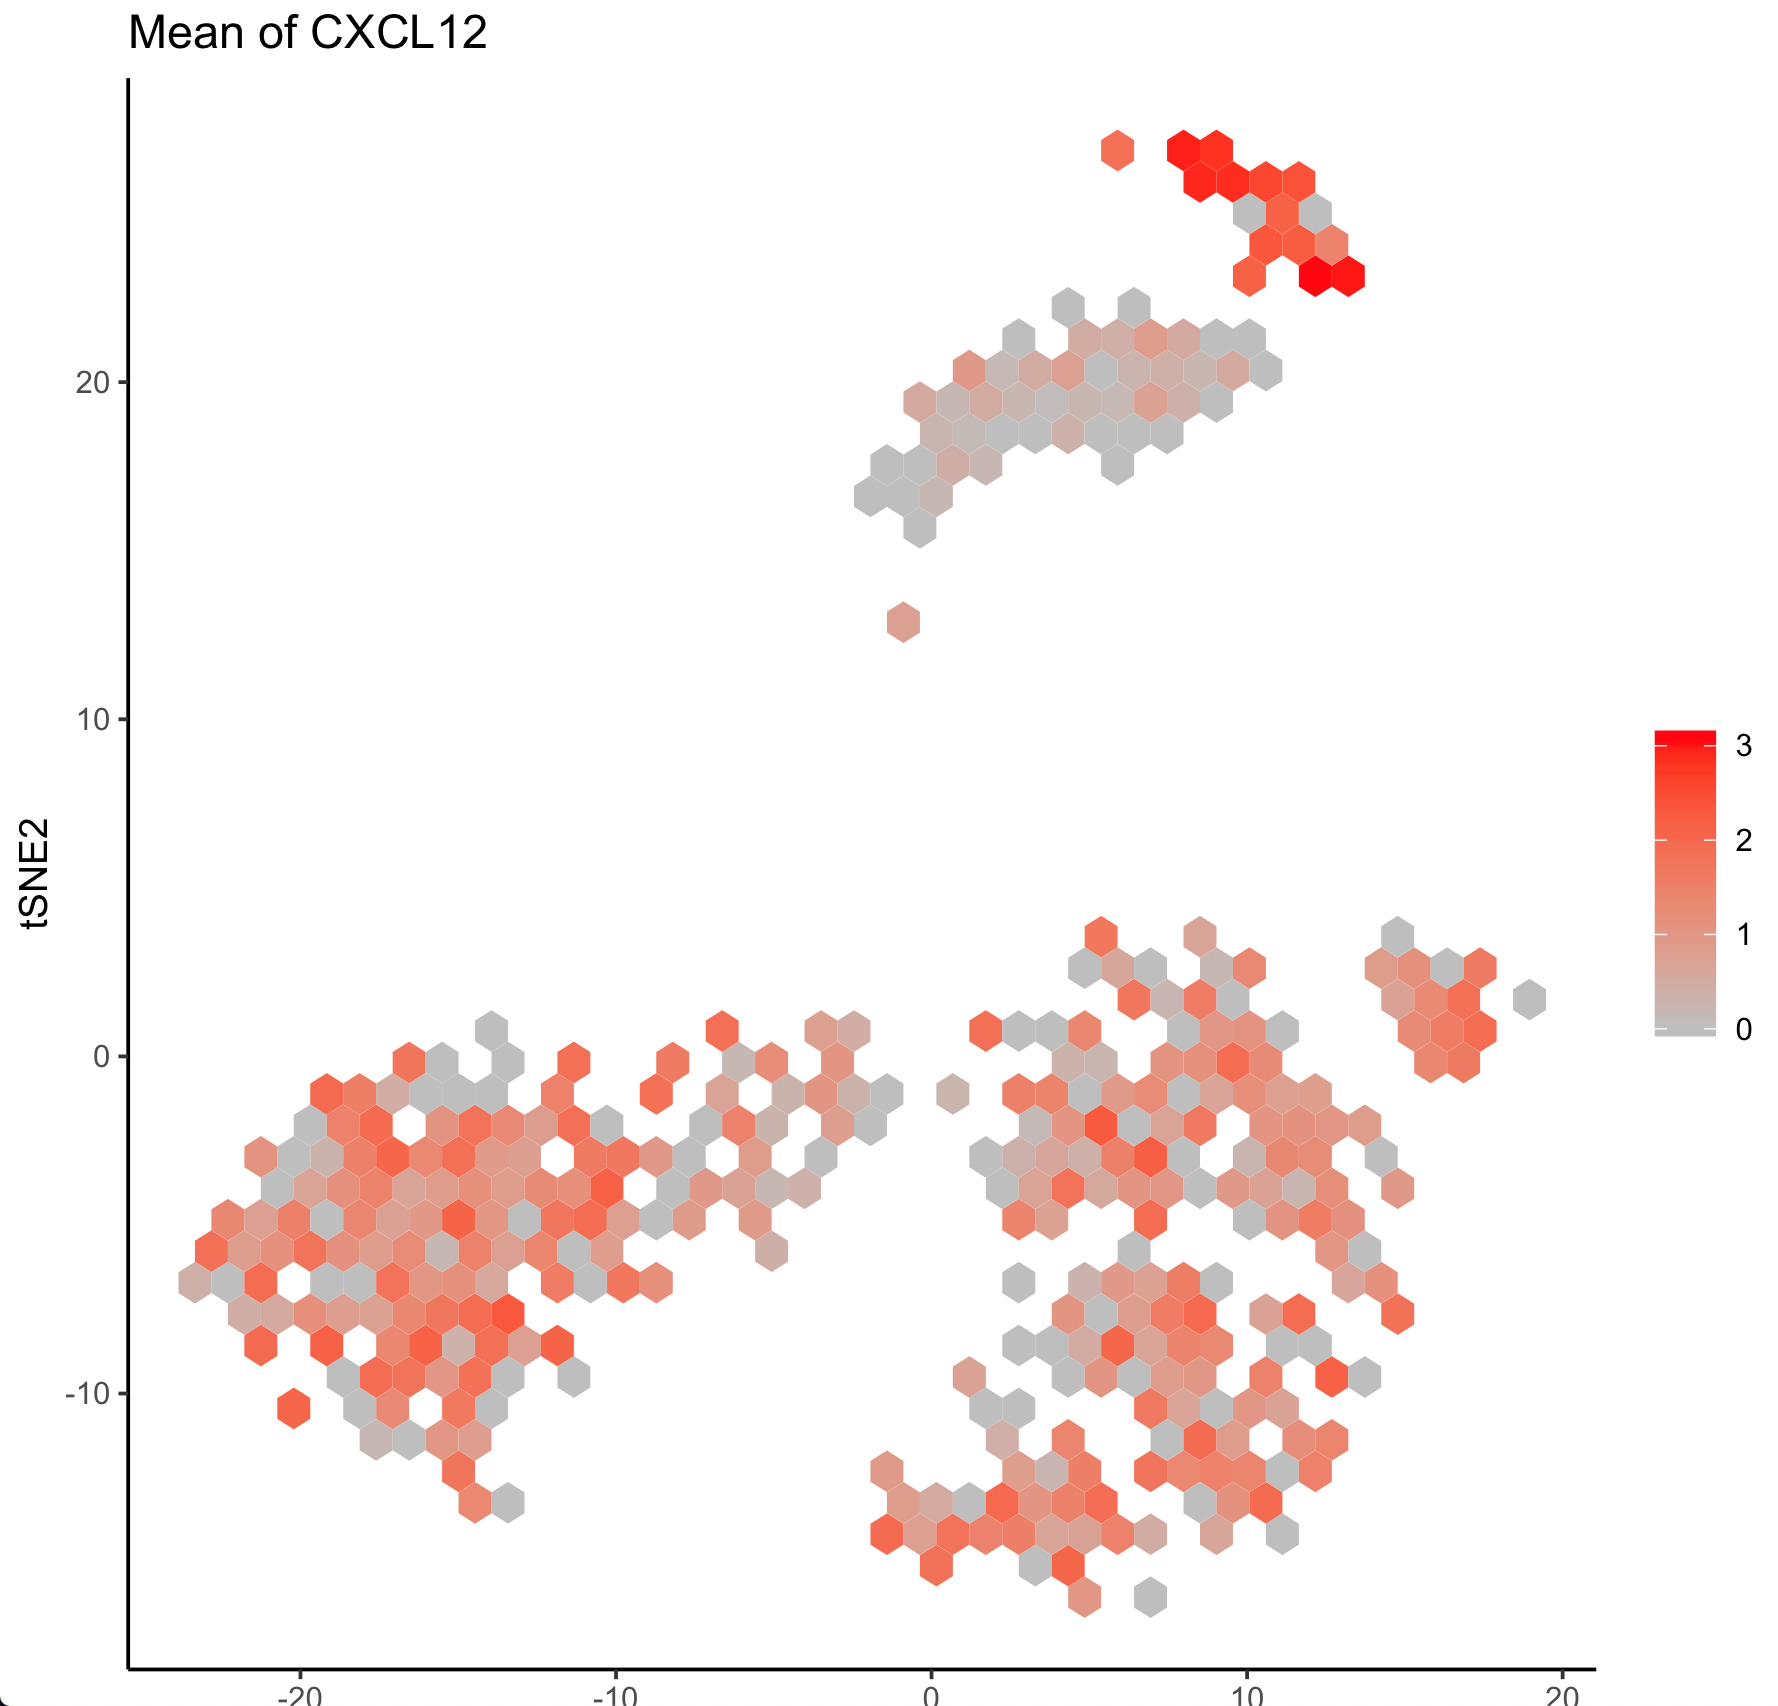
BioC3.10でリリースされたschexパッケージは、このような問題を解決するために作られたもので、2次元プロットを六角形のビンで区切り、そのビンごとに平均をとる。
このパッケージにより、以下のようにリガンドの発現量もプロットできた。
なお、デフォルト色がviridisで、これを変更するのに苦労したが、警告メッセージは出るものの、色を変えることはできた (参考: https://github.com/SaskiaFreytag/schex/issues/5 )。
# Package loading
library("scTensor")
library("schex")
library("SingleCellExperiment")

# Data loading
data("GermMale")
data("tsneGermMale")

# SingleCellExperiment Object
sce <- SingleCellExperiment(assays = list(counts = GermMale))
reducedDims(sce) <- list(tSNE=tsneGermMale$Y)
logcounts(sce) <- log10(GermMale + 1)

# Setting Hex bin
sce <- make_hexbin(sce, nbins = 40, dimension_reduction = "tSNE")

# Plot
gene_id <-"6387"
gene_name <- "CXCL12"
g <- schex::plot_hexbin_gene(sce, type="logcounts", gene=gene_id,
	action="mean", xlab="tSNE1", ylab="tSNE2",
	title=paste0("Mean of ", gene_name))
g <- g + scale_fill_gradient(low = 'gray', high = 'red')
plot(g)
nbinでビンの数も変えられるので、10^5 - 10^6細胞くらいの込み入ったプロットを描く場合は、もう少し細かく区切ってもいいかもしれない。
次のscTensorのバージョンアップで早速schexベースに切り替える予定。