行列の対角化とは、ある正方行列を以下の形に分解すること
cf. https://ja.wikipedia.org/wiki/対角化
A = P^T\Lambda P
このような正則行列$P$が存在する場合、相似変換といい、対角行列は$\Lambda$は元の行列Aの固有値になる。
行列対角化を実現するための教科書的な手法としてヤコビ法があり、処理としては、行列Aに平面回転行列P(ギブンス行列)を繰り返し両側からかける。
(全く同じ名前で連立方程式を解く手法があることに注意 cf. https://ja.wikipedia.org/wiki/ヤコビ法 )
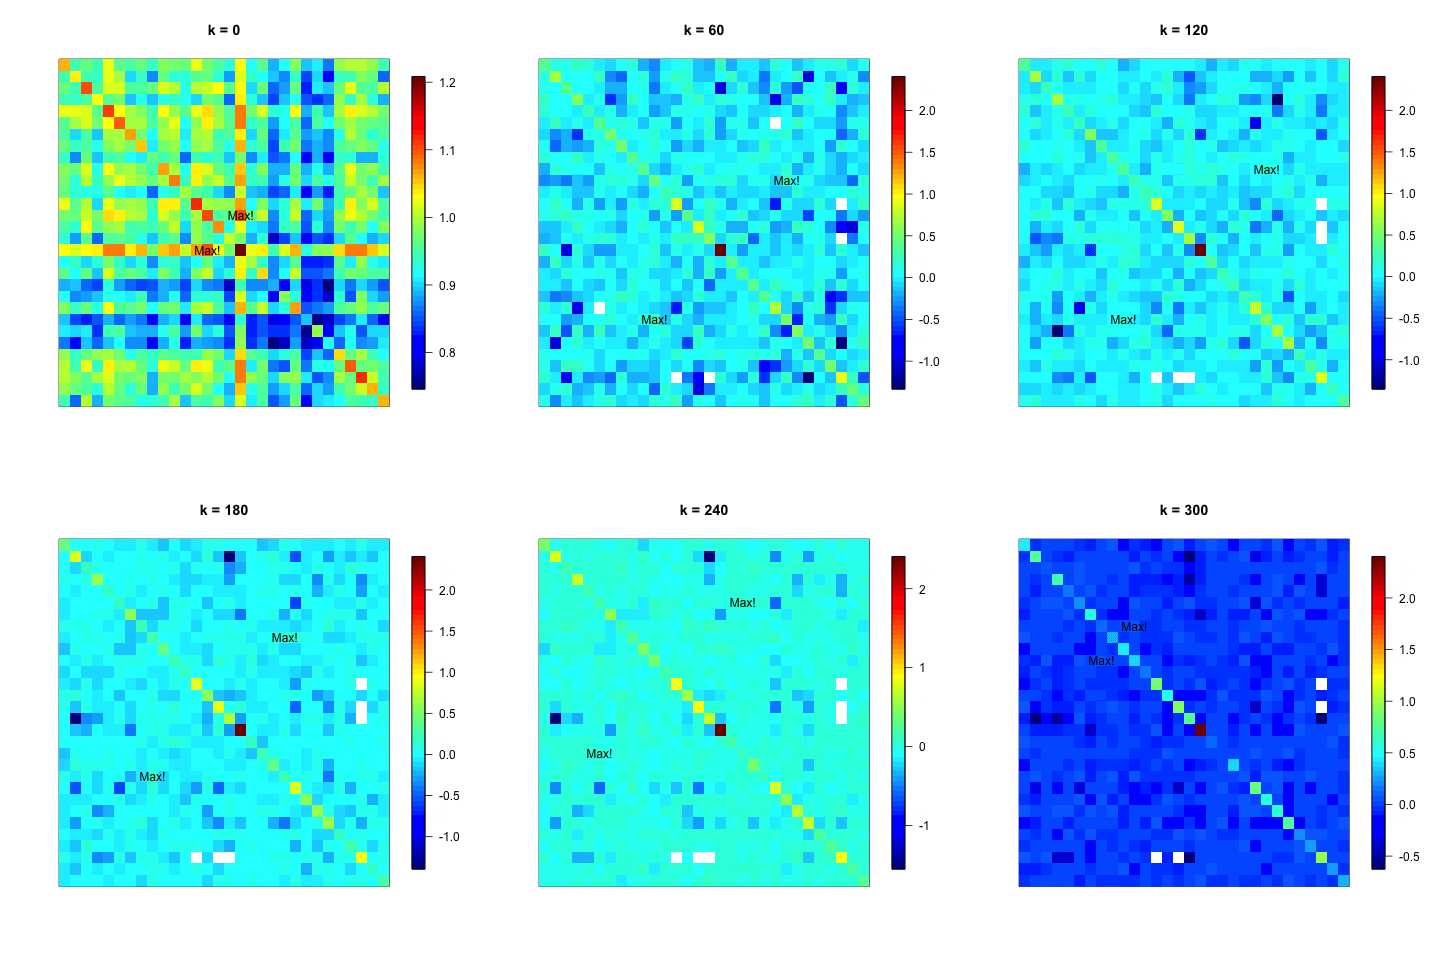
ここでは、各ステップごとに、行列が徐々に対角化されていく様子を可視化する。
library("fields")
library("stringr")

MaxNonDiag <- function(A){
  # To select only upper triangle elements
  diag(A) <- min(A)
  A[lower.tri(A)] <- min(A)
  MaxPos <- max(A) == A
  # Row Position
  k <- unlist(apply(MaxPos, 2, function(x){
    which(x == TRUE)
  }))
  # Columns Position
  l <- unlist(apply(MaxPos, 1, function(x){
    which(x == TRUE)
  }))
  # Return
  c(k,l)
}

GivensMatrix <- function(A){
  R <- diag(1, nrow(A))
  MP <- MaxNonDiag(A)
  k <- MP[1]
  l <- MP[2]
  if(A[k,k] != A[l,l]){
      theta <- 0.5 * atan(-2*A[k,l] / (A[k,k] - A[l,l]))
    }else{
      theta <- pi / 4
    }
  # Return R
  R[k,k] <- cos(theta)
  R[l,k] <- -sin(theta)
  R[k,l] <- sin(theta)
  R[l,l] <- cos(theta)
  R
}

plotA <- function(A, k, l, step){
  image.plot(log10(A[, ncol(A):1]+1),
    main=paste0("k = ", step),
    xaxt="n", yaxt = "n")
  pos <- seq(0, 1, length = nrow(A))
  text(pos[k], 1-pos[l], "Max!")
  text(pos[l], 1-pos[k], "Max!")
}

Jacobi <- function(A, thr=1E-2, viz=FALSE, viz.dir=""){
  MP <- MaxNonDiag(A)
  k <- MP[1]
  l <- MP[2]
  U <- diag(1, nrow(A))
  step <- 1
  if(viz){
    if(viz.dir==""){
      plotA(A, k, l, 0)
      Sys.sleep(0.2)
    }else{
      png(file=paste0(viz.dir, "/Step0000.png"))
      plotA(A, k, l, 0)
      dev.off()
    }
  }
  while(A[k,l] > thr){
    R <- GivensMatrix(A)
    U <- U %*% R
    A <- t(R) %*% A %*% R # Update
    MP <- MaxNonDiag(A)
    k <- MP[1]
    l <- MP[2]
    if(viz){
      if(viz.dir==""){
        plotA(A, k, l, step)
        Sys.sleep(0.2)
      }else{
        png(file=paste0(viz.dir, "/Step",
          str_sub(paste0("000", step), start = -4),
          ".png"))
        plotA(A, k, l, step)
        dev.off()
      }
    }
    step <- step + 1
  }
  list(U=U, Sigma=A)
}


# 固有値がdiag(3,1)
# 固有ベクトルがc(1/sqrt(2), 1/sqrt(2))と正解がわかっているデータで確認
A <- rbind(2:1, 1:2)
Jacobi(A, viz=TRUE)
eigen(A) # eigenとも一致

# 30×30行列でも実験
dir.create("Jacobi", showWarnings=FALSE)
A <- matrix(runif(30*30), nrow=30, ncol=30)
A <- t(A) %*% A
eigen(A)
out <- Jacobi(A, viz=TRUE, viz.dir="./Jacobi")
"Max!"と書かれている非対角要素は次のステップでギブンス回転によって0になる予定箇所。
行列Aが徐々に対角要素を残して値の小さな行列になっていく様子がわかる。
ただし、ある非対角要素を0にすることで、他の要素の値が変化するため、一度0にした要素が再び非ゼロになるため、収束するまで計算を繰り返す必要がある。
参考
計算による線形代数
Matrix Computation
[Pythonによる科学・技術計算] ヤコビ法による実対称行列の固有値・固有ベクトルの数値計算,数値線形代数
