Cesium.jsをAngularアプリケーションの中で使うことになったので、知見を共有しようと思います。
割と基礎的な内容ですが、英語のドキュメントを読むのに辛い思いをしたので備忘録を兼ねて投稿します。願わくば誰かの役に立たんことを……。
Cesium.jsとは?
Cesium.jsの説明についてはこちらの記事で基本的なところは解説しているので、省きます。
https://qiita.com/keijipoon/items/615ebaf7561a27d744f5
準備
まずは新しいAngularのプロジェクトを作ります。
ng new cesium-project
プロジェクトに移動し、ng serveでサーバが起動しているかを確認します。
cd cesium-project
ng serve
確認したらサーバを停止し、AngularCLIからライブラリを追加。ここまでやったら準備は一旦完了です。
ng add angular-cesium
npmコマンドでマニュアルインストール可能だが、設定が面倒くさい。何かの理由でマニュアルインストールする場合は下記参照。
https://docs.angular-cesium.com/getting-started/installation
地形と構造物の表示
さて、まずは地図の表示をしますので新規にコンポーネントを作成しましょう。
下記コマンドでmapコンポーネントを作成します。
cd src/app
ng g c map
map.component.htmlを以下のように書き換えます。
<div id="cesiumContainer"></div>
map.component.tsを以下のように書き換えます。
import { Component, OnInit } from "@angular/core";

@Component({
  selector: "app-map",
  templateUrl: "./map.component.html",
  styleUrls: ["./map.component.scss"],
})
export class MapComponent implements OnInit {
  constructor() {}

  ngOnInit(): void {
    const viewer = new Cesium.Viewer("cesiumContainer", {
      terrainProvider: Cesium.createWorldTerrain(),//地形情報を表示するオプション
    });
    scene.primitives.add(Cesium.createOsmBuildings());//OpenStreetMapというプロジェクトで作成された簡易なモデルを表示できる
    viewer.camera.flyTo({//目的の座標にカメラを向ける処理
      destination: Cesium.Cartesian3.fromDegrees(139.767125, 35.681236, 1000), //経度,緯度,高さの順に指定
    });
  }
}
ここで、app.component.htmlを以下のように書き換えます。
<router-outlet></router-outlet>
app-routing.module.tsも書き換えましょう。
import { NgModule } from "@angular/core";
import { Routes, RouterModule } from "@angular/router";
import { MapComponent } from "./map/map.component";

const routes: Routes = [{ path: "", component: MapComponent }];

@NgModule({
  imports: [RouterModule.forRoot(routes)],
  exports: [RouterModule],
})
export class AppRoutingModule {}
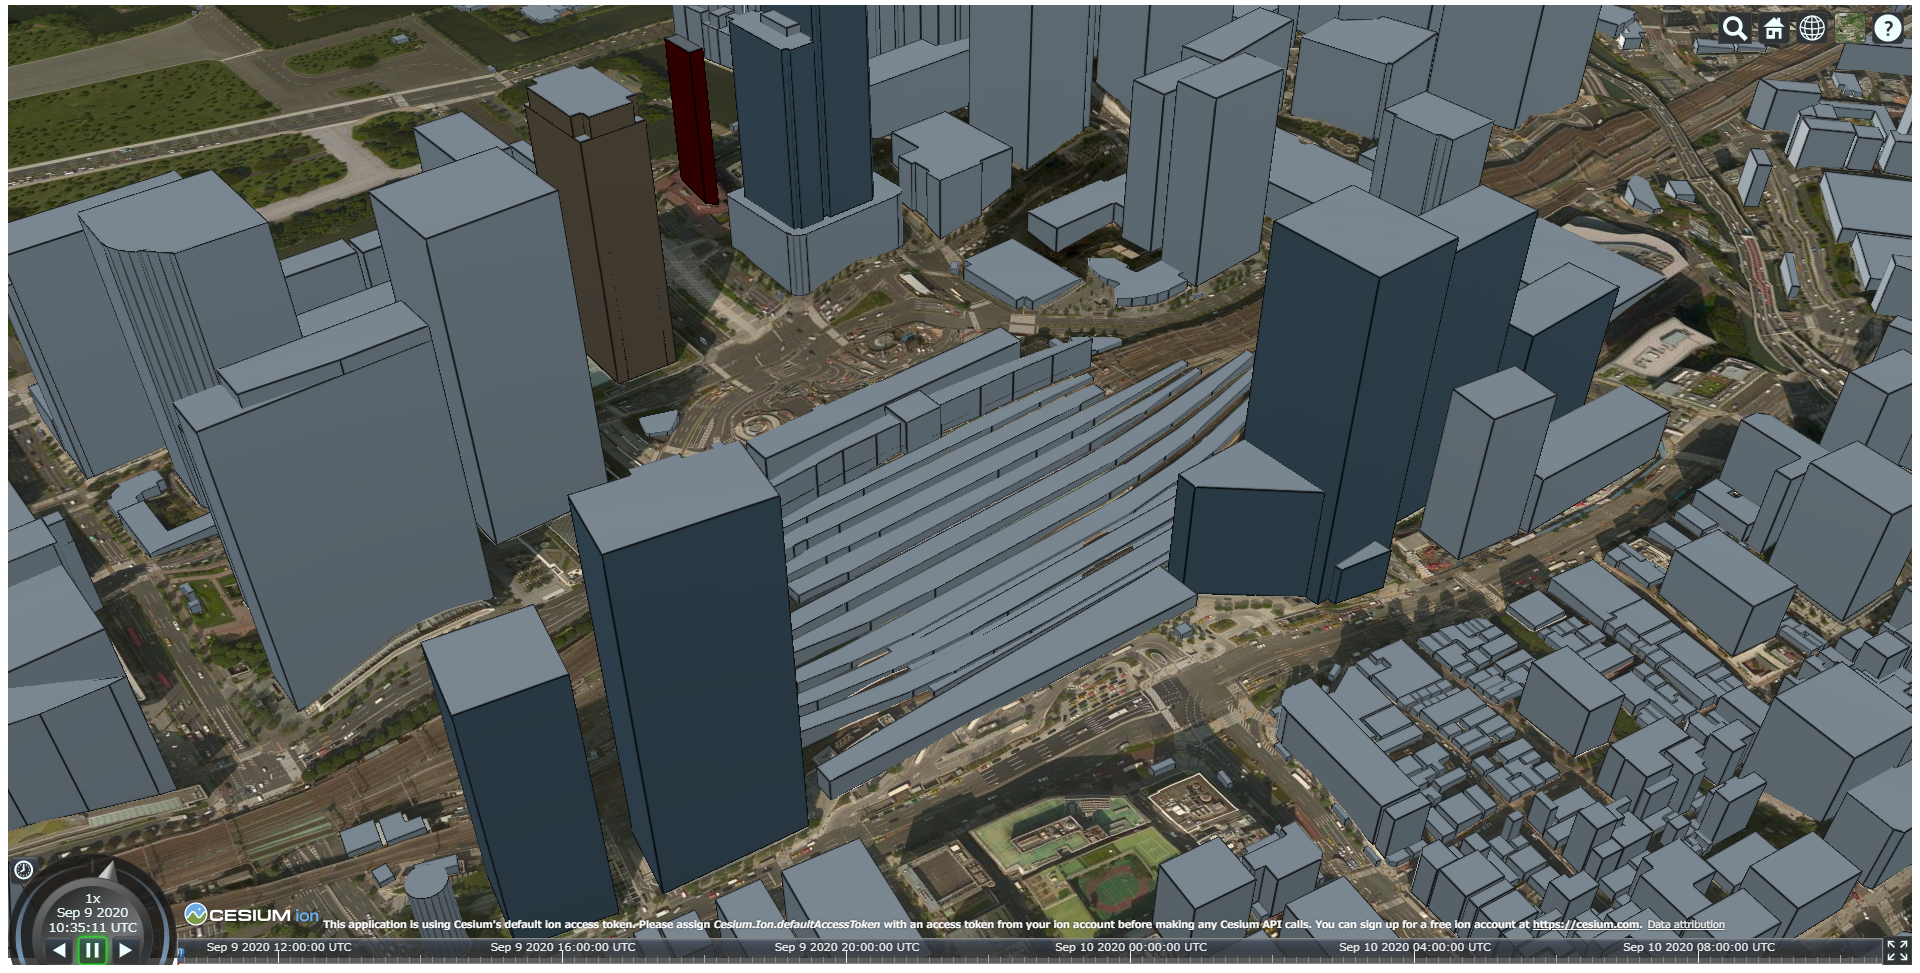
ここまで来たら、再度ng serveでサーバを起動。
すると下記画像のように東京駅周辺の地図情報を3D表示することができました。
軌跡を表示する
map.component.tsのngOnInit()の中に下記の処理を追加します。
もちろんリストの中の値は適当です。
//軌跡表示
    viewer.entities.add({
      polyline: {
        positions: Cesium.Cartesian3.fromDegreesArrayHeights([
          139.767125,
          35.681236,
          300,
          139.768,
          35.682,
          300,
          139.7685,
          35.681,
          300,
          139.769,
          35.683,
          300,
          139.768,
          35.683,
          300,
        ]),
        width: 5,
        material: Cesium.Color.RED,
      },
    });
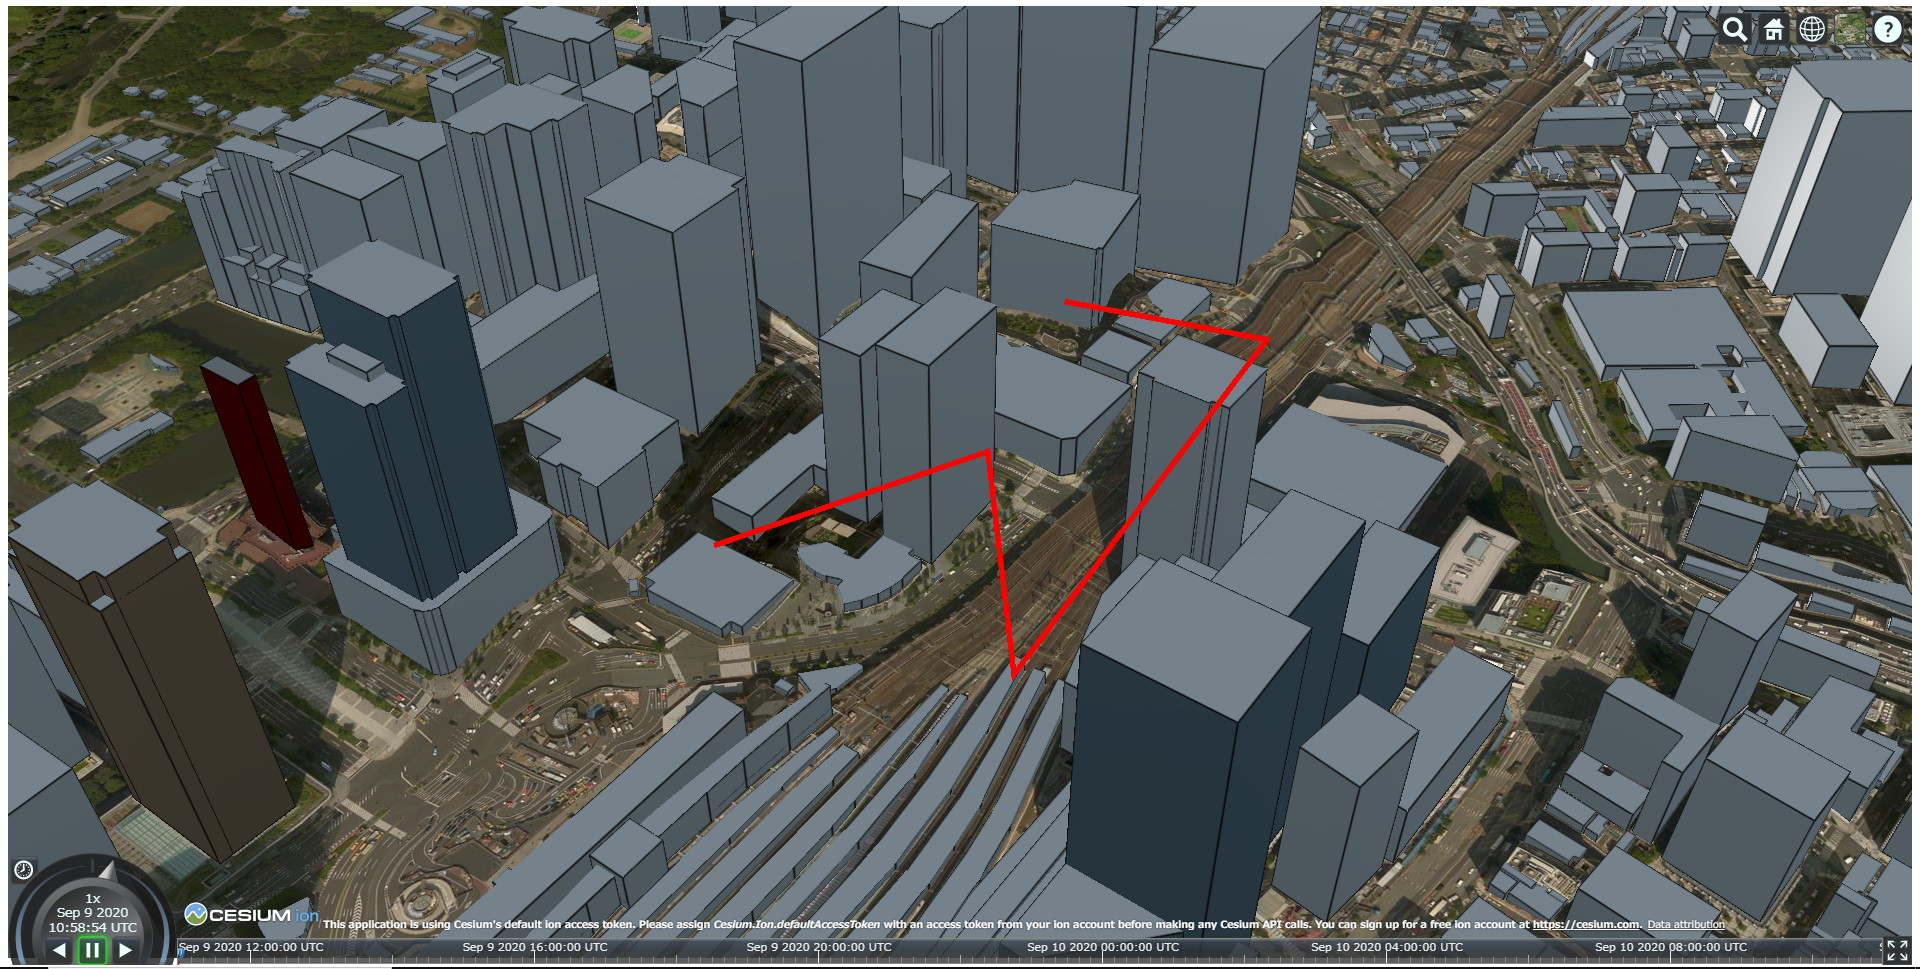
保存して画面を確認します。赤いラインが表示されているのがわかります。
軌跡上を動くオブジェクトを表示する
map.component.tsのngOnInit()の中に下記の処理を追加します。
フリーで転がっていたドローンのモデル(.glb形式)をダウンロードし、src/assetsに入れました。
//アニメーションの処理。
    let czml = [
      {
        //Cesium特有のczmlというJSON形式のデータを作る
        id: "document",
        name: "CZML",
        version: "1.0",
        clock: {
          //アニメーションのループ間隔を指定する
          interval: "2020-09-02T12:00:00Z/2020-09-02T12:00:08Z", //画面下部のタイムバーの始値と終値を定義する。ここにはフライト開始時刻と終了時刻を入れる
          currentTime: "2020-09-02T12:00:00Z", //フライト開始時刻を入れる
          multiplier: 1, //n倍速の指定。固定値にするかは要検討。
          range: "LOOP_STOP"
          step: "SYSTEM_CLOCK_MULTIPLIER",
        },
      },
      {
        id: "drone",
        name: "drone",
        availability: "2020-09-02T12:00:00Z/2020-09-02T12:00:08Z", //ここにフライト開始時刻とフライト終了時刻を指定する
        position: {
          epoch: "2020-09-02T12:00:00Z",
          cartographicDegrees: [
            //秒,経度,緯度,高さの順番
            0, 139.767125, 35.681236, 300,
            2, 139.768, 35.682, 300,
            4, 139.7685, 35.681, 300,
            6, 139.769, 35.683, 300,
            8, 139.768, 35.683, 300,
          ],
        },
        model: {
          gltf: "assets/drone.glb",//3Dモデルの指定
          outlineColor: {
            rgba: [0, 0, 0, 255],
          },
        },
      },
    ];
    viewer.dataSources.add(Cesium.CzmlDataSource.load(czml));
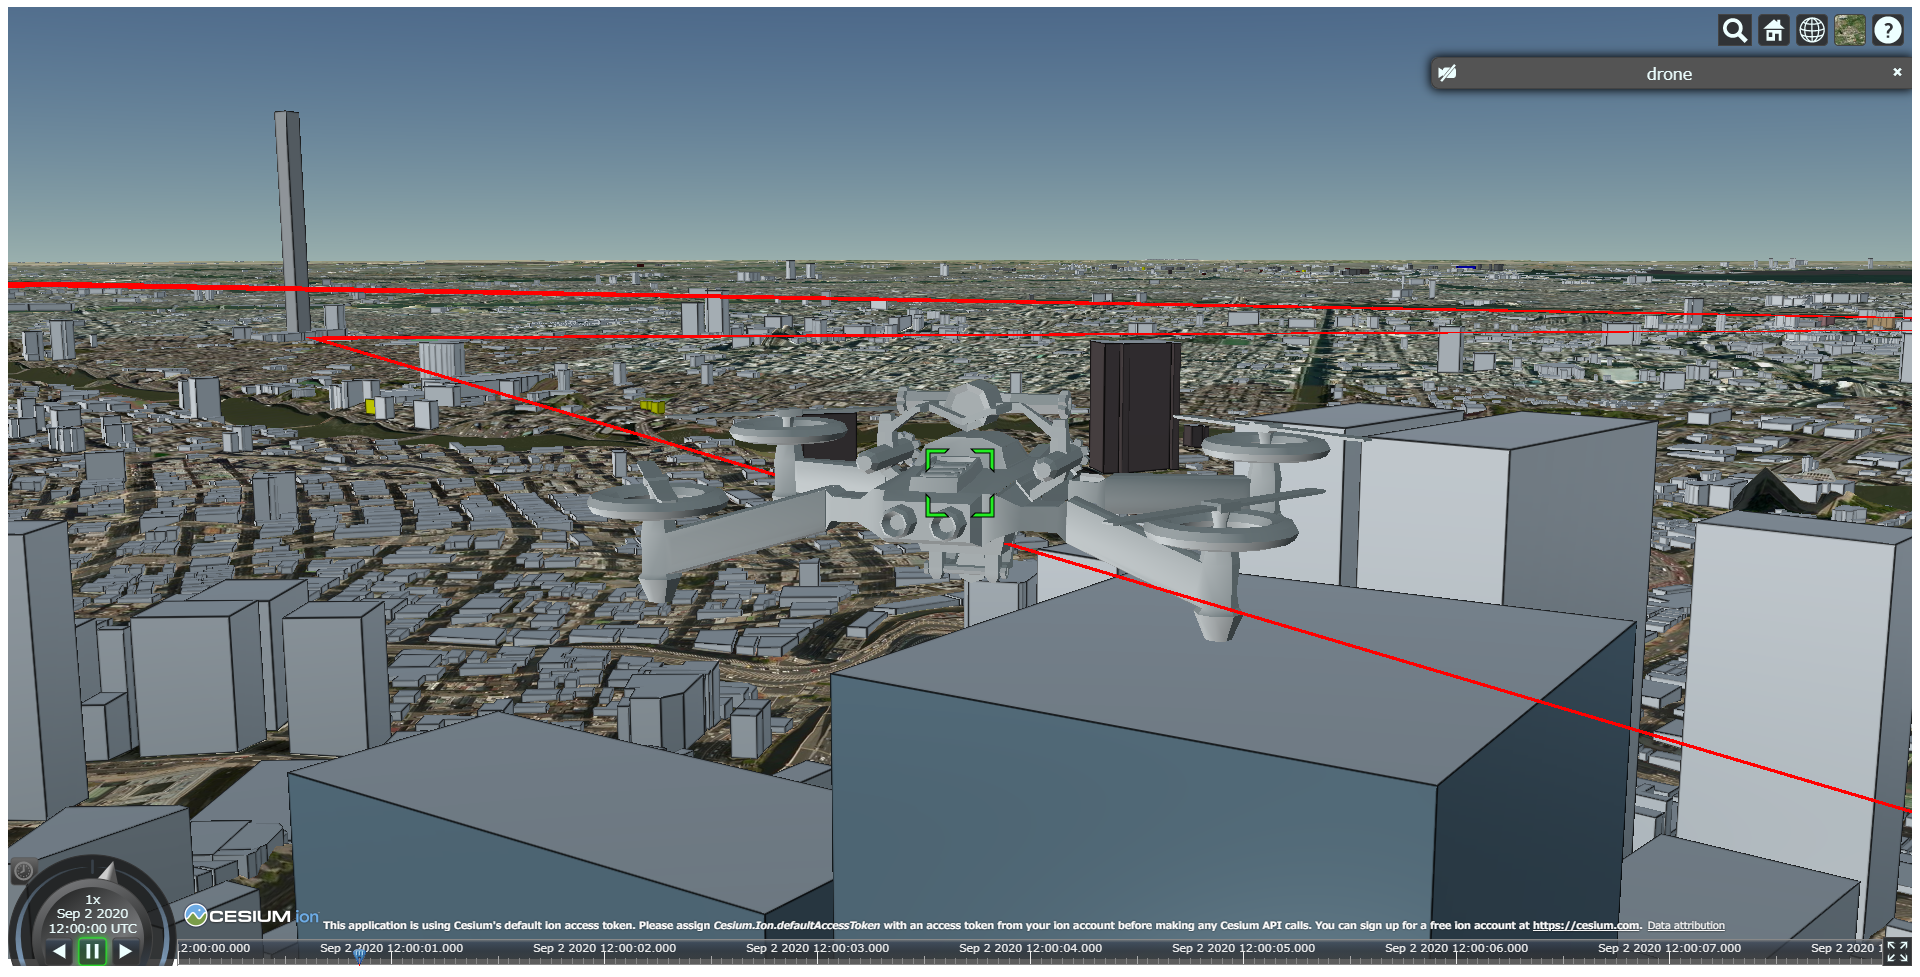
保存して画面を表示し、画面左下の再生ボタンをクリックするとアニメーションが行われるはずです。
総括
この界隈はあまり日本語のドキュメントがなく、苦労したので何かの役に立てば幸いです。
座標データを取得できるハードウェアなどと連携できれば、いろいろな可能性が見えてきそうです。
参考にしたサイトのURLを張っておきます。
https://sandcastle.cesium.com
https://gis-oer.github.io/gitbook/book/materials/web_gis/Cesium/Cesium.html