timechartコマンドの目的
データを時系列でグラフ化するコマンド。by句で複数の系列を同時に表示できる。トレンドやパターンの発見に使う。
| timechart span=15m count by vendor_action
limitオプションとは
表示する系列の最大数を制限するオプション。フィールドの種類(値の種類)の数を制限する。上位N件だけ表示し、残りは「OTHER」にまとめる。デフォルトは
| timechart span=15m count by vendor_action limit=3
N件 = フィールドのユニーク値の数
例:
by vendor_action で limit=3 の場合
vendor_actionの値:ssh_login、password_auth、key_auth、sudo、cron...など10個ある
上位3個(出現回数が多い値)だけ個別に表示
残り7個は全部「OTHER」にまとめる
limitの実例
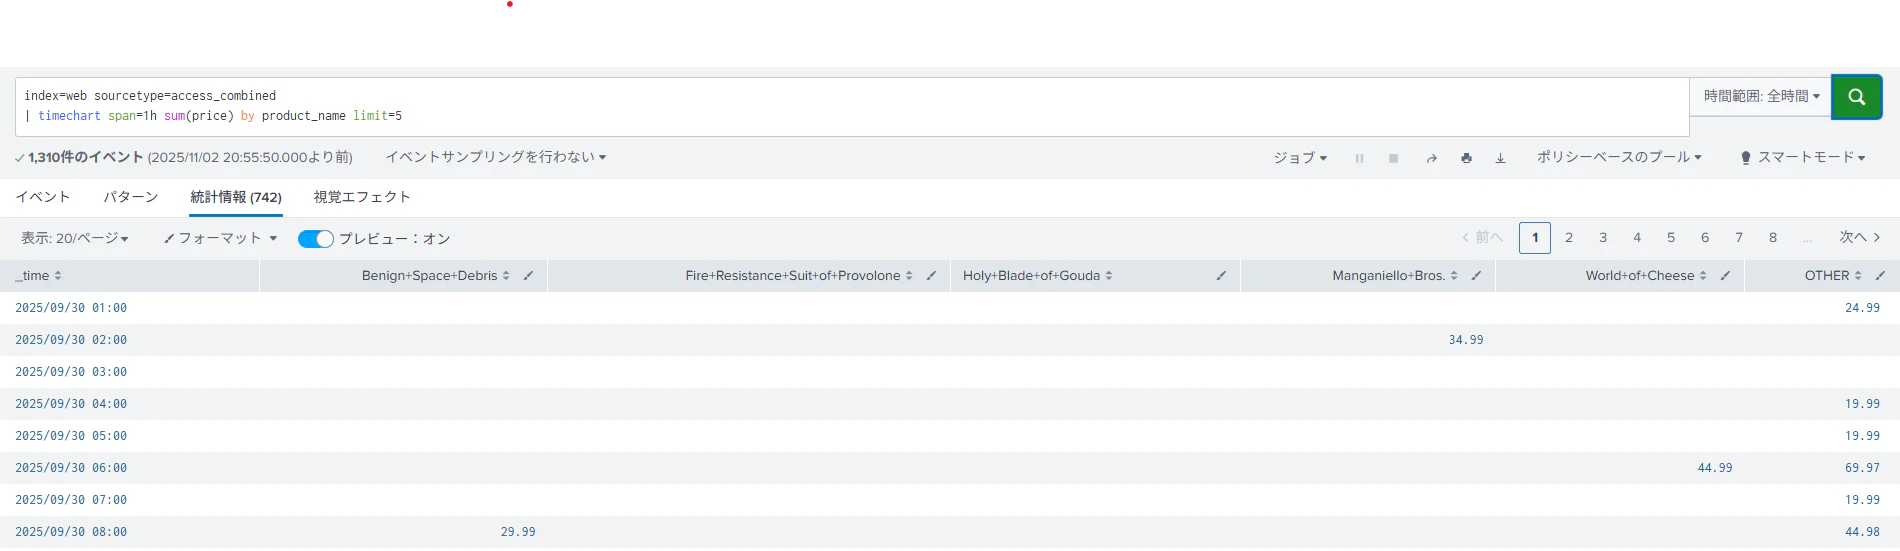
index=web sourcetype=access_combined
| timechart span=1h sum(price) by product_name limit=5
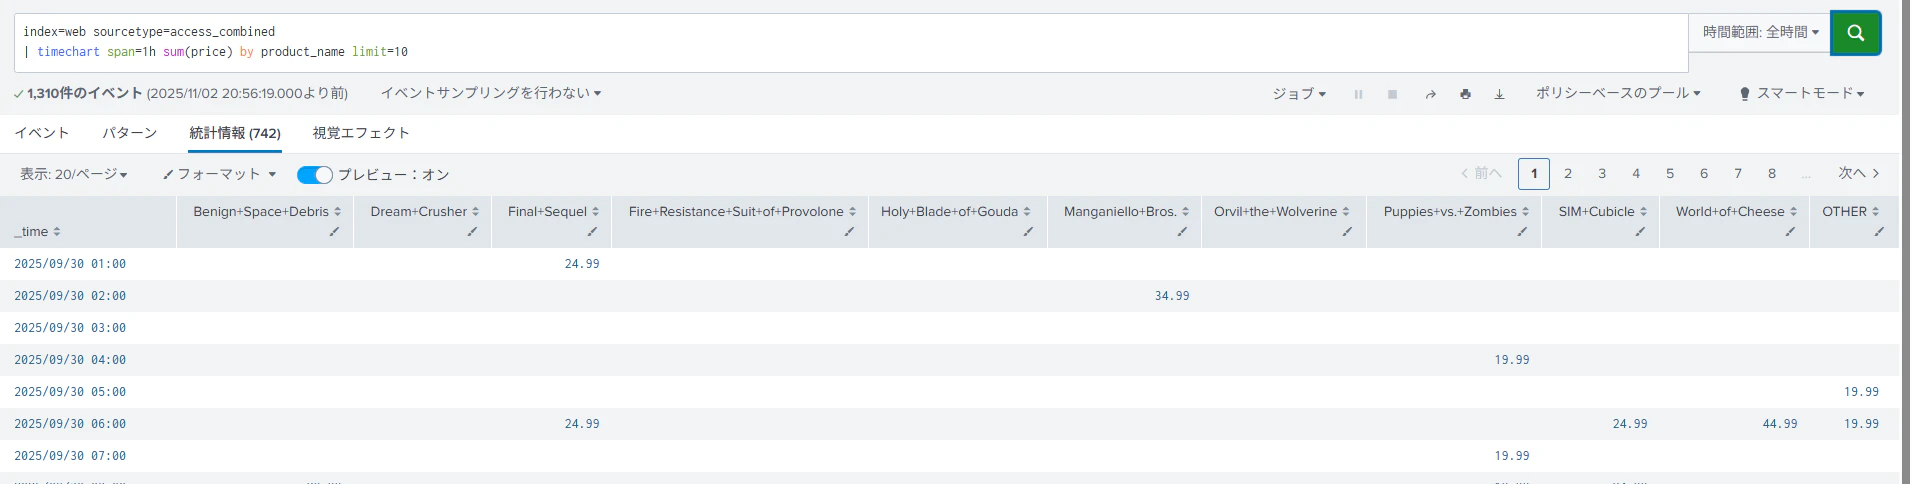
index=web sourcetype=access_combined
| timechart span=1h sum(price) by product_name limit=10
グラフが見にくいときは?
データポイントが多すぎると横軸ラベルが重なって表示されず、グラフも複雑になる。spanを大きくする(15m→1h)でデータポイントを減らし、limitを小さくする(limit=3)で系列数を減らせば見やすくなる。