Numpyでハフ変換による直線検出を実装してみます。
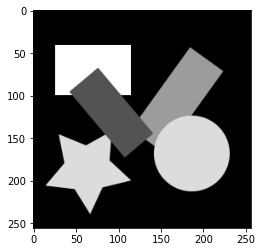
直線を検出する画像を読み込みます。
import numpy as np
import matplotlib.pyplot as plt

original_image = plt.imread(image_name)
if np.issubdtype(original_image.dtype, np.integer):
  original_image = original_image / np.iinfo(original_image.dtype).max
gray_image = 0.2116 * original_image[:,:,0] + 0.7152 * original_image[:,:,1] + 0.0722 * original_image[:,:,2]
plt.imshow(gray_image, cmap='gray')
エッジ画像を作成します。ここでは、Cannyのエッジ検出を用います。Cannyのエッジ検出については以下の記事を参照してください。
【画像処理】NumpyでCannyエッジ検出 - Qiita
def _convolve2d(image, kernel):
  shape = (image.shape[0] - kernel.shape[0] + 1, image.shape[1] - kernel.shape[1] + 1) + kernel.shape
  strides = image.strides * 2
  strided_image = np.lib.stride_tricks.as_strided(image, shape, strides)
  return np.einsum('kl,ijkl->ij', kernel, strided_image)

def _convolve2d_multichannel(image, kernel):
  convolved_image = np.empty((image.shape[0] - kernel.shape[0] + 1, image.shape[1] - kernel.shape[1] + 1, image.shape[2]))
  for i in range(image.shape[2]):
    convolved_image[:,:,i] = _convolve2d(image[:,:,i], kernel)
  return convolved_image

def _pad_singlechannel_image(image, kernel_shape, boundary):
  return np.pad(image, ((int(kernel_shape[0] / 2),), (int(kernel_shape[1] / 2),)), boundary)

def _pad_multichannel_image(image, kernel_shape, boundary):
  return  np.pad(image, ((int(kernel_shape[0] / 2),), (int(kernel_shape[1] / 2),), (0,)), boundary)

def convolve2d(image, kernel, boundary='edge'):
  if image.ndim == 2:
    pad_image = _pad_singlechannel_image(image, kernel.shape, boundary) if boundary is not None else image
    return _convolve2d(pad_image, kernel)
  elif image.ndim == 3:
    pad_image = _pad_multichannel_image(image, kernel.shape, boundary) if boundary is not None else image
    return _convolve2d_multichannel(pad_image, kernel)

def create_gaussian_kernel(size=(3, 3), sigma=1):
  center = ((size[0] - 1) / 2, (size[1] - 1) / 2)
  sigma2 = 2 * sigma * sigma
  kernel = np.fromfunction(lambda y, x: np.exp(-((x - center[1]) ** 2 + (y - center[0]) ** 2) / sigma2), size)
  kernel = kernel / np.sum(kernel)
  return kernel

def _suppress_nonmaximum(array):
  direction = array[9]
  if direction < 0:
    direction += np.pi
  if direction < 0.125 * np.pi:
    v0, v1, v2 = (array[3], array[4], array[5])
  elif direction < 0.375 * np.pi:
    v0, v1, v2 = (array[2], array[4], array[6])
  elif direction < 0.625 * np.pi:
    v0, v1, v2 = (array[1], array[4], array[7])
  elif direction < 0.875 * np.pi:
    v0, v1, v2 = (array[0], array[4], array[8])
  else:
    v0, v1, v2 = (array[3], array[4], array[5])
  return v1 if v1 >= v0 and v1 >= v2 else 0

def suppress_nonmaximum(intensity_image, direction_image):
  pad_image = np.pad(intensity_image, 1, 'edge')
  shape = intensity_image.shape + (3, 3)
  strides = pad_image.strides * 2
  strided_image = np.lib.stride_tricks.as_strided(pad_image, shape, strides).reshape(shape[0], shape[1], 9)
  return np.apply_along_axis(_suppress_nonmaximum, 2, np.dstack((strided_image, direction_image)))

def histeresis_thresholding(image, threshold):
  edge_image = np.where(image >= threshold[1], 1.0, 0.0)
  while True:
    pad_edge_image = np.pad(edge_image, 1, 'edge')
    shape = image.shape + (3, 3)
    strides = pad_edge_image.strides * 2
    neighbour_edge_image = np.lib.stride_tricks.as_strided(pad_edge_image, shape, strides)
    edge_candidate_index = np.where((image >= threshold[0]) & (edge_image != 1.0))

    changed = False
    for index in list(zip(*edge_candidate_index)):
      if np.any(neighbour_edge_image[index] == 1.0):
        edge_image[index] = 1.0
        changed = True
    if not changed:
      break;
  return edge_image

def canny(image, gaussian_size=(3, 3), gaussian_sigma=1, threshold=(0.02, 0.05)):
  gaussian_kernel = create_gaussian_kernel(size=gaussian_size, sigma=gaussian_sigma)
  gaussian_image = convolve2d(gray_image, gaussian_kernel)
  sobel_x_kernel = np.array([[-1, 0, 1], [-2, 0, 2], [-1, 0, 1]])
  sobel_x_image = convolve2d(gaussian_image, sobel_x_kernel) / 8
  sobel_y_kernel = np.array(([[1, 2, 1], [0, 0, 0], [-1, -2, -1]]))
  sobel_y_image = convolve2d(gaussian_image, sobel_y_kernel) / 8
  sobel_intensity_image = np.sqrt(sobel_x_image ** 2 + sobel_y_image ** 2)
  sobel_direction_image = np.arctan(np.divide(sobel_y_image, sobel_x_image, out=np.zeros_like(sobel_y_image), where=sobel_x_image!=0))
  nonmaximum_suppression_image = suppress_nonmaximum(sobel_intensity_image, sobel_direction_image)
  return histeresis_thresholding(nonmaximum_suppression_image, threshold)

edge_image = canny(gray_image, gaussian_size=(3, 3), gaussian_sigma=0.2, threshold=(0.05, 0.2))
plt.imshow(edge_image, cmap='gray')

直線を次のように$(r, \theta)$で表します。$r$は原点から直線までの最短距離、$\theta$は原点からの直線までの最短地点を結んだ直線と原点がなす角度です。
r = x\cos\theta + y\sin\theta
上式よりエッジ画素$(x_e, y_e)$を通る直線は以下のようになります。
r = x_e\cos\theta + y_e\sin\theta
$(r, \theta)$パラメータ空間を一定間隔で区切り、エッジ画素ごとに$\theta$を少しづつ変えながら$r$を求めます。求めた$(r, \theta)$の組み合わせをカウント(投票)していきます。
edges = np.where(edge_image == 1.0)
r_max = np.sqrt(edge_image.shape[0] ** 2 + edge_image.shape[1] ** 2)
votes = np.zeros((int(r_max), 180), dtype=int)
for edge in list(zip(edges[1], edges[0])):
  for i in range(votes.shape[1]):
    ang = np.deg2rad(i)
    r = edge[0] * np.cos(ang) + edge[1] * np.sin(ang)
    votes[int(r)][i] += 1

plt.figure(figsize=(8,8))
plt.imshow(votes, aspect=0.5)
plt.colorbar()
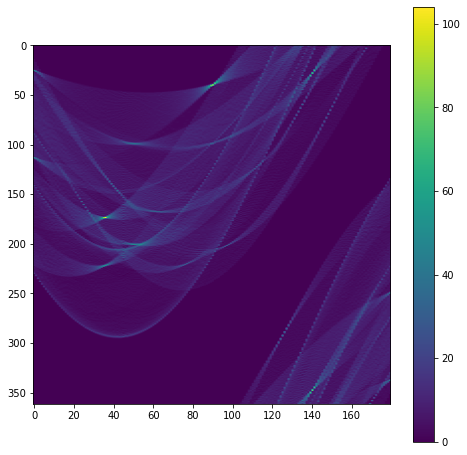
多数の投票が集まった$(r,\theta)$が検出された直線になります。検出された直線を画像上に描画してみます。直線の描画については以下の記事を参照してください。
【画像処理】Numpyで図形描画 - Qiita
def is_local_maximum(image, size=(5, 5), boundary='edge'):
  pad_image = np.pad(image, ((int(size[0] / 2),), (int(size[1] / 2),)), boundary)
  areas = np.lib.stride_tricks.as_strided(pad_image, image.shape + size, pad_image.strides * 2)
  local_maximum = np.max(areas, axis=(2, 3))
  return image == local_maximum

def draw_line(image, color, weight, point1, point2):
  coord = np.fromfunction(lambda y, x: np.dstack((y + 0.5, x + 0.5)), image.shape[:2])
  p12 = np.array([point2[1] - point1[1], point2[0] - point1[0]])
  p12_norm = np.linalg.norm(p12)
  p12_dir = p12 / p12_norm
  p1c = np.dstack(([coord[:,:,0] - point1[1], coord[:,:,1] - point1[0]]))
  dot = np.einsum('ijk,k->ij', p1c, p12_dir)
  dist = np.sqrt(p1c[:,:,0] ** 2 + p1c[:,:,1] ** 2 - dot ** 2)
  condition = (dot >= 0) & (dot <= p12_norm) & (dist <= weight * 0.5)
  if image.ndim == 3:
    condition = np.tile(condition.reshape(condition.shape + (1,)), (1, 1, image.shape[2]))
  return np.where(condition, color, image)

def draw_hough_lines(image, lines, color, weight):
  for line in lines:
    s = np.sin(line[1])
    c = np.cos(line[1])
    if s > 0.01:
      p1 = (0.0, line[0] / s)
      p2 = (image.shape[1], (line[0] - image.shape[1] * c) / s)
      image = draw_line(image, color, weight, p1, p2)
    else:
      p1 = (line[0] / c, 0.0)
      p2 = ((line[0] - image.shape[0] * s) / c, image.shape[0])
      image = draw_line(image, color, weight, p1, p2)
  return image

hough_lines = np.where(is_local_maximum(votes, size=(5, 5)) & (votes >= 50))
hough_line_image = draw_hough_lines(original_image, list(zip(hough_lines[0], np.deg2rad(hough_lines[1]))), np.array([1.0, 0.0, 1.0]), 2.0)
plt.imshow(hough_line_image)
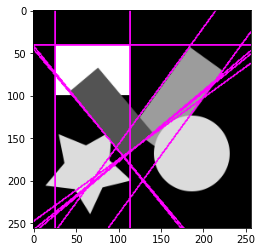
これでハフ変換による直線の検出ができました。
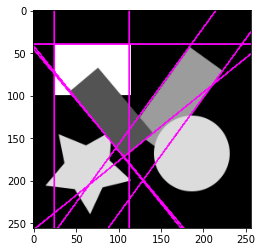
ハフ変換による直線検出を1つの関数にまとめると次のようになります。
def detect_hough_lines(edge_image, vote_size, threshold, local_maximum_size):
  votes = np.zeros(vote_size, dtype=int)
  r_step = np.sqrt(edge_image.shape[0] ** 2 + edge_image.shape[1] ** 2) / vote_size[0]
  theta_step = np.pi / vote_size[1]
  edges = np.where(edge_image)
  for edge in list(zip(edges[1], edges[0])):
    for i in range(vote_size[1]):
      angle = i * theta_step
      r = edge[0] * np.cos(angle) + edge[1] * np.sin(angle)
      votes[int(r / r_step)][i] += 1
  lines = np.where(is_local_maximum(votes) & (votes >= threshold))
  return list(zip(lines[0] * r_step, lines[1] * theta_step))

r_max = np.sqrt(edge_image.shape[0] ** 2 + edge_image.shape[1] ** 2)
hough_lines = detect_hough_lines(edge_image == 1.0, (int(r_max), 180), 50, (5, 5))
hough_line_image = draw_hough_lines(original_image, hough_lines, np.array([1.0, 0.0, 1.0]), 2.0)
plt.imshow(hough_line_image)
実装したコードはGoogle Colaboratoryに置いてあります。