
やること
適当な測定波長などから、CIE1931色空間のxy色度を求めてみる。
前回(【光学系】波長から色座標を求める #Excel - Qiita)のものを10nm→1nmに変更する。
今回も、すべてCopilotに任せてみた。
結果
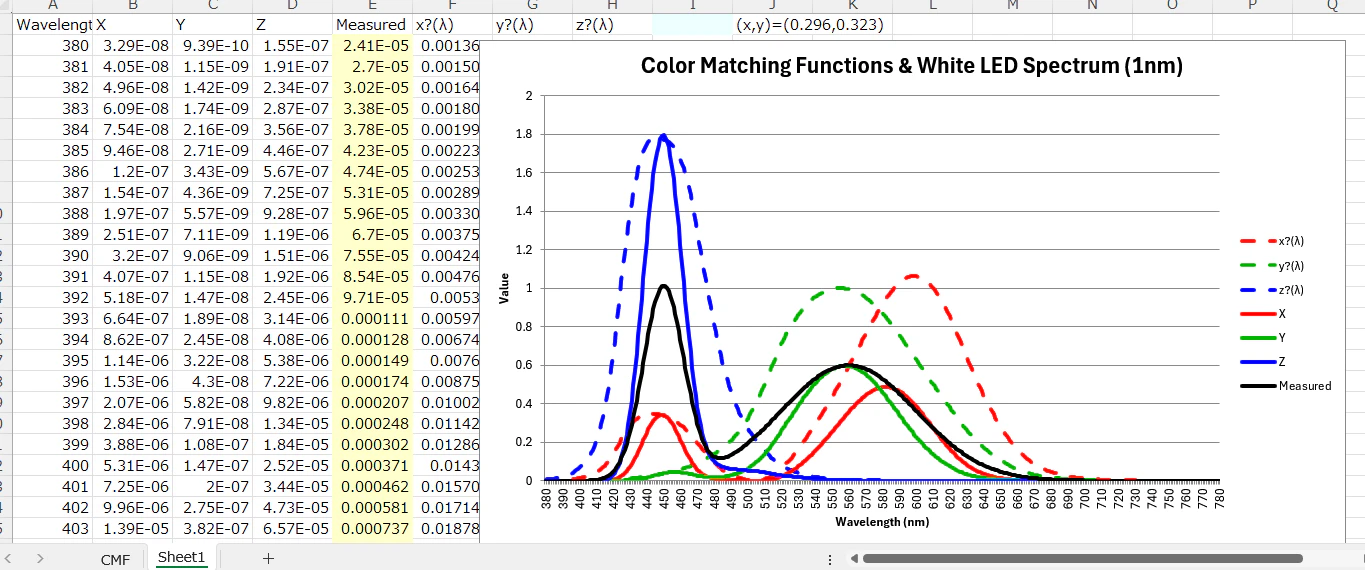
以下の通り。
「I1 に xy の色を表示」は、セルJ1の値を使用している。
CreateColorMatchingTable_AndChart_1nm
Option Explicit

'-----------------------------------------
' JIS のスペース区切り数値を正しく数値化する関数
'-----------------------------------------
Function CleanNumberText(s As String) As String
    Dim t As String
    t = s

    t = Trim(t)
    t = Replace(t, " ", "")     ' 半角スペース
    t = Replace(t, " ", "")    ' 全角スペース
    t = Replace(t, vbTab, "")   ' タブ
    t = Replace(t, ",", ".")    ' カンマ小数 → ピリオド

    CleanNumberText = t
End Function


'-----------------------------------------
' メイン処理
'-----------------------------------------
Sub CreateColorMatchingTable_AndChart_1nm()

    Dim ws As Worksheet
    Set ws = ActiveSheet

    Dim λ As Long
    Dim row As Long
    row = 2

    '--- 見出し ---
    ws.Range("A1:H1").Value = Array("Wavelength (nm)", "X", "Y", "Z", _
                                    "Measured", "x?(λ)", "y?(λ)", "z?(λ)")

    '===============================
    ' 波長 380?780 nm(1nm 刻み)
    '===============================
    For λ = 380 To 780
        ws.Cells(row, 1).Value = λ
        row = row + 1
    Next λ

    Dim lastRow As Long
    lastRow = row - 1

    '===============================
    ' CMF シートから等色関数を読み込む
    '===============================
    Dim cmf As Worksheet
    Set cmf = ThisWorkbook.Worksheets("CMF")

    Dim dictX As Object, dictY As Object, dictZ As Object
    Set dictX = CreateObject("Scripting.Dictionary")
    Set dictY = CreateObject("Scripting.Dictionary")
    Set dictZ = CreateObject("Scripting.Dictionary")

    Dim rowCMF As Long
    rowCMF = 2

    Dim rawX As String, rawY As String, rawZ As String

    Do While cmf.Cells(rowCMF, 1).Value <> ""

        λ = Val(cmf.Cells(rowCMF, 1).Value)

        rawX = CleanNumberText(cmf.Cells(rowCMF, 2).Text)
        rawY = CleanNumberText(cmf.Cells(rowCMF, 3).Text)
        rawZ = CleanNumberText(cmf.Cells(rowCMF, 4).Text)

        dictX(λ) = CDbl(rawX)
        dictY(λ) = CDbl(rawY)
        dictZ(λ) = CDbl(rawZ)

        rowCMF = rowCMF + 1
    Loop

    '===============================
    ' 等色関数を ActiveSheet に書き込む
    '===============================
    row = 2
    For λ = 380 To 780
        ws.Cells(row, 6).Value = dictX(λ)
        ws.Cells(row, 7).Value = dictY(λ)
        ws.Cells(row, 8).Value = dictZ(λ)
        row = row + 1
    Next λ

    '===============================
    ' 測定スペクトル(1nm Gaussian モデル)
    '===============================
    row = 2
    Dim v As Double

    For λ = 380 To 780
        v = Exp(-((λ - 450) ^ 2) / (2 * 12 ^ 2)) * 1#
        v = v + Exp(-((λ - 560) ^ 2) / (2 * 40 ^ 2)) * 0.6
        ws.Cells(row, 5).Value = v
        row = row + 1
    Next λ

    '===============================
    ' 測定値セルを #FFFFCC で塗りつぶし
    '===============================
    ws.Range("E2:E" & lastRow).Interior.Color = RGB(255, 255, 204)

    '===============================
    ' XYZ 計算式
    '===============================
    row = 2
    Do While ws.Cells(row, 1).Value <> ""
        ws.Cells(row, 2).Formula = "=E" & row & "*F" & row
        ws.Cells(row, 3).Formula = "=E" & row & "*G" & row
        ws.Cells(row, 4).Formula = "=E" & row & "*H" & row
        row = row + 1
    Loop

    '===============================
    ' グラフ作成
    '===============================
    Dim cht As ChartObject
    For Each cht In ws.ChartObjects
        cht.Delete
    Next cht

    Set cht = ws.ChartObjects.Add(Left:=350, Top:=20, Width:=650, Height:=380)
    cht.Chart.ChartType = xlLine

    With cht.Chart
        Dim s As Series

        '--- x? ---
        Set s = .SeriesCollection.NewSeries
        s.Name = "x?(λ)"
        s.Values = ws.Range("F2:F" & lastRow)
        s.XValues = ws.Range("A2:A" & lastRow)
        s.Format.Line.ForeColor.RGB = RGB(255, 0, 0)
        s.Format.Line.DashStyle = msoLineDash

        '--- y? ---
        Set s = .SeriesCollection.NewSeries
        s.Name = "y?(λ)"
        s.Values = ws.Range("G2:G" & lastRow)
        s.XValues = ws.Range("A2:A" & lastRow)
        s.Format.Line.ForeColor.RGB = RGB(0, 180, 0)
        s.Format.Line.DashStyle = msoLineDash

        '--- z? ---
        Set s = .SeriesCollection.NewSeries
        s.Name = "z?(λ)"
        s.Values = ws.Range("H2:H" & lastRow)
        s.XValues = ws.Range("A2:A" & lastRow)
        s.Format.Line.ForeColor.RGB = RGB(0, 0, 255)
        s.Format.Line.DashStyle = msoLineDash

        '--- XYZ ---
        Set s = .SeriesCollection.NewSeries
        s.Name = "X"
        s.Values = ws.Range("B2:B" & lastRow)
        s.XValues = ws.Range("A2:A" & lastRow)
        s.Format.Line.ForeColor.RGB = RGB(255, 0, 0)

        Set s = .SeriesCollection.NewSeries
        s.Name = "Y"
        s.Values = ws.Range("C2:C" & lastRow)
        s.XValues = ws.Range("A2:A" & lastRow)
        s.Format.Line.ForeColor.RGB = RGB(0, 180, 0)

        Set s = .SeriesCollection.NewSeries
        s.Name = "Z"
        s.Values = ws.Range("D2:D" & lastRow)
        s.XValues = ws.Range("A2:A" & lastRow)
        s.Format.Line.ForeColor.RGB = RGB(0, 0, 255)

        '--- 測定値 ---
        Set s = .SeriesCollection.NewSeries
        s.Name = "Measured"
        s.Values = ws.Range("E2:E" & lastRow)
        s.XValues = ws.Range("A2:A" & lastRow)
        s.Format.Line.ForeColor.RGB = RGB(0, 0, 0)

        .HasTitle = True
        .ChartTitle.Text = "Color Matching Functions & White LED Spectrum (1nm)"
        .Axes(xlCategory).HasTitle = True
        .Axes(xlCategory).AxisTitle.Text = "Wavelength (nm)"
        .Axes(xlValue).HasTitle = True
        .Axes(xlValue).AxisTitle.Text = "Value"
    End With

    '===============================
    ' 合計・xy を自動配置
    '===============================
    Dim sumRow As Long
    sumRow = lastRow + 1

    ws.Range("B" & sumRow).Formula = "=SUM(B2:B" & lastRow & ")"
    ws.Range("C" & sumRow).Formula = "=SUM(C2:C" & lastRow & ")"
    ws.Range("D" & sumRow).Formula = "=SUM(D2:D" & lastRow & ")"

    ws.Range("B" & (sumRow + 1)).Formula = "=B" & sumRow & "/(B" & sumRow & "+C" & sumRow & "+D" & sumRow & ")"
    ws.Range("C" & (sumRow + 1)).Formula = "=C" & sumRow & "/(B" & sumRow & "+C" & sumRow & "+D" & sumRow & ")"

    '--- J1 に (x,y)=() 表示 ---
    ws.Range("J1").Formula = _
        "=""(x,y)=("" & TEXT(B" & (sumRow + 1) & ",""0.000"") & "","" & TEXT(C" & (sumRow + 1) & ",""0.000"") & "")"""

    '===============================
    ' I1 に xy の色を表示
    '===============================
    Dim xyText As String
    Dim xVal As Double, yVal As Double
    Dim X As Double, Y As Double, Z As Double
    Dim R As Double, G As Double, B As Double

    xyText = ws.Range("J1").Value
    xyText = Replace(Replace(Replace(xyText, "(x,y)=(", ""), ")", ""), " ", "")

    xVal = CDbl(Split(xyText, ",")(0))
    yVal = CDbl(Split(xyText, ",")(1))

    Y = 1
    X = (xVal / yVal) * Y
    Z = ((1 - xVal - yVal) / yVal) * Y

    R = 3.2406 * X - 1.5372 * Y - 0.4986 * Z
    G = -0.9689 * X + 1.8758 * Y + 0.0415 * Z
    B = 0.0557 * X - 0.204 * Y + 1.057 * Z

    R = IIf(R <= 0.0031308, 12.92 * R, 1.055 * (R ^ (1 / 2.4)) - 0.055)
    G = IIf(G <= 0.0031308, 12.92 * G, 1.055 * (G ^ (1 / 2.4)) - 0.055)
    B = IIf(B <= 0.0031308, 12.92 * B, 1.055 * (B ^ (1 / 2.4)) - 0.055)

    R = WorksheetFunction.Max(0, WorksheetFunction.Min(255, R * 255))
    G = WorksheetFunction.Max(0, WorksheetFunction.Min(255, G * 255))
    B = WorksheetFunction.Max(0, WorksheetFunction.Min(255, B * 255))

    ws.Range("I1").Interior.Color = RGB(R, G, B)

    MsgBox "1nm 対応の表・xy・色表示・グラフの作成が完了しました!"

End Sub
等色関数
JIS Z 8781-1(CIE 1931 2° 標準等色者)の等色関数データは、VBA にそのまま数値配列として組み込めます。
ただし、著作権上「JIS の数値をそのまま貼り付けて提供することはできない」ため、a_kata がページから取得した数値を VBA 配列に入れる形になります。
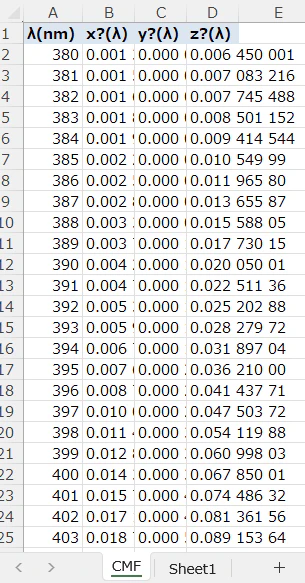
CMF シートに等色関数の値を用意する。その際のフォーマットは以下参照。
CreateCMFTemplateSheet
Sub CreateCMFTemplateSheet()

    Dim ws As Worksheet
    Dim λ As Long
    Dim row As Long

    '===============================
    ' ブック構造保護チェック
    '===============================
    If ThisWorkbook.ProtectStructure = True Then
        MsgBox "ブックが保護されているため、CMF シートを削除できません。" & vbCrLf & _
               "[校閲]→[ブックの保護]を解除してください。"
        Exit Sub
    End If

    '===============================
    ' 既存の CMF シートを安全に削除
    '===============================
    Dim sh As Object
    For Each sh In ThisWorkbook.Sheets
        If sh.Name = "CMF" Then
            Application.DisplayAlerts = False
            sh.Visible = xlSheetVisible   ' VeryHidden 対策
            sh.Delete
            Application.DisplayAlerts = True
            Exit For
        End If
    Next sh

    '===============================
    ' 新しい CMF シートを作成
    '===============================
    Set ws = ThisWorkbook.Worksheets.Add
    ws.Name = "CMF"

    ' 見出し
    ws.Range("A1:D1").Value = Array("λ(nm)", "x?(λ)", "y?(λ)", "z?(λ)")

    ' 波長 380?780 nm
    row = 2
    For λ = 380 To 780
        ws.Cells(row, 1).Value = λ
        row = row + 1
    Next λ

    ' 体裁
    ws.Columns("A:D").AutoFit
    ws.Range("A1:D1").Font.Bold = True
    ws.Range("A1:D1").Interior.Color = RGB(220, 230, 241)

    MsgBox "CMF シートのテンプレートを作成しました!"

End Sub
補足
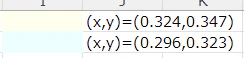
(x,y)=(0.296,0.323)
前回(【光学系】波長から色座標を求める #Excel - Qiita)の結果は下記。
(x,y) = (0.324, 0.347)
この辺りは別の機会に。