1次元Kernel密度推定:density( )
データの取得と確認
イエローストーン国立公園にあるOld Faithful間欠泉の噴出時間
のデータを解析します。
データセットの取得
feに噴出時間データのみを抜き出す
> head(faithful)
  eruptions waiting
1     3.600      79
2     1.800      54
3     3.333      74
4     2.283      62
5     4.533      85
6     2.883      55
> fe <- faithful$eruption
度数分布, Histgramを確認
> stem(fe)
  The decimal point is 1 digit(s) to the left of the |
  16 | 070355555588
  18 | 000022233333335577777777888822335777888
  20 | 00002223378800035778
  22 | 0002335578023578
  24 | 00228
  26 | 23
  28 | 080
  30 | 7
  32 | 2337
  34 | 250077
  36 | 0000823577
  38 | 2333335582225577
  40 | 0000003357788888002233555577778
  42 | 03335555778800233333555577778
  44 |002222335557780000000023333357778888
  46 | 0000233357700000023578
  48 | 00000022335800333
  50 | 0370
hist(fe, freq=FALSE)
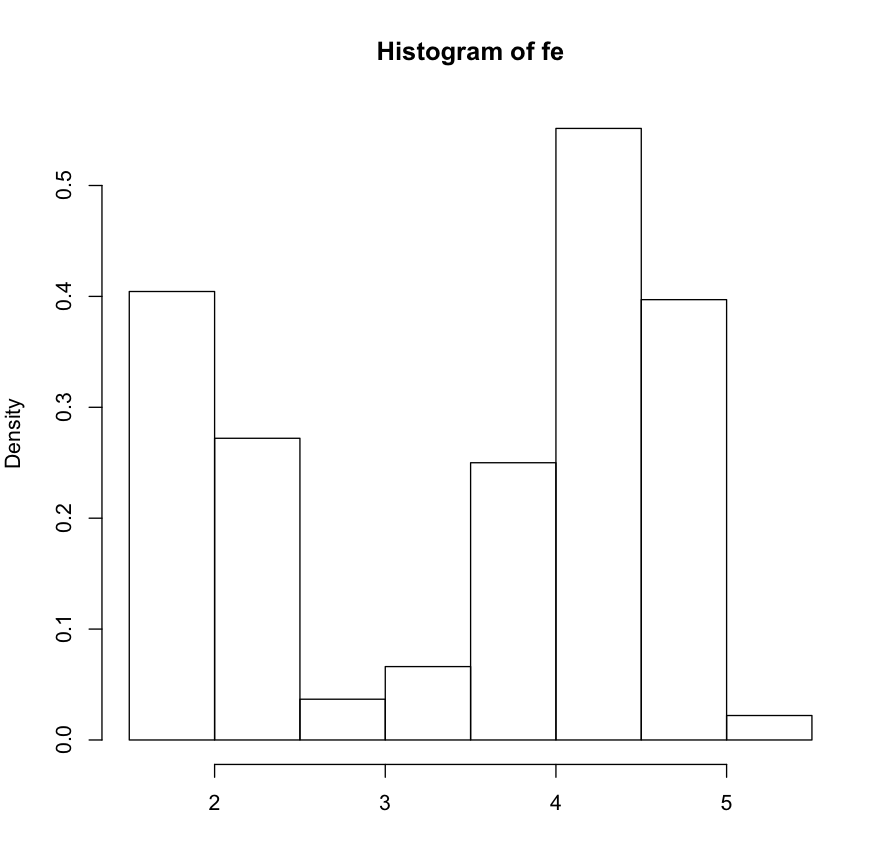
Kernel密度推定
観測データのヒストグラムからKernel密度推定を行う。
ここではRにあるdensity関数を用いる。
> fe.d <- density(fe)
> hist(fe, freq = FALSE)
> lines(fe.d)
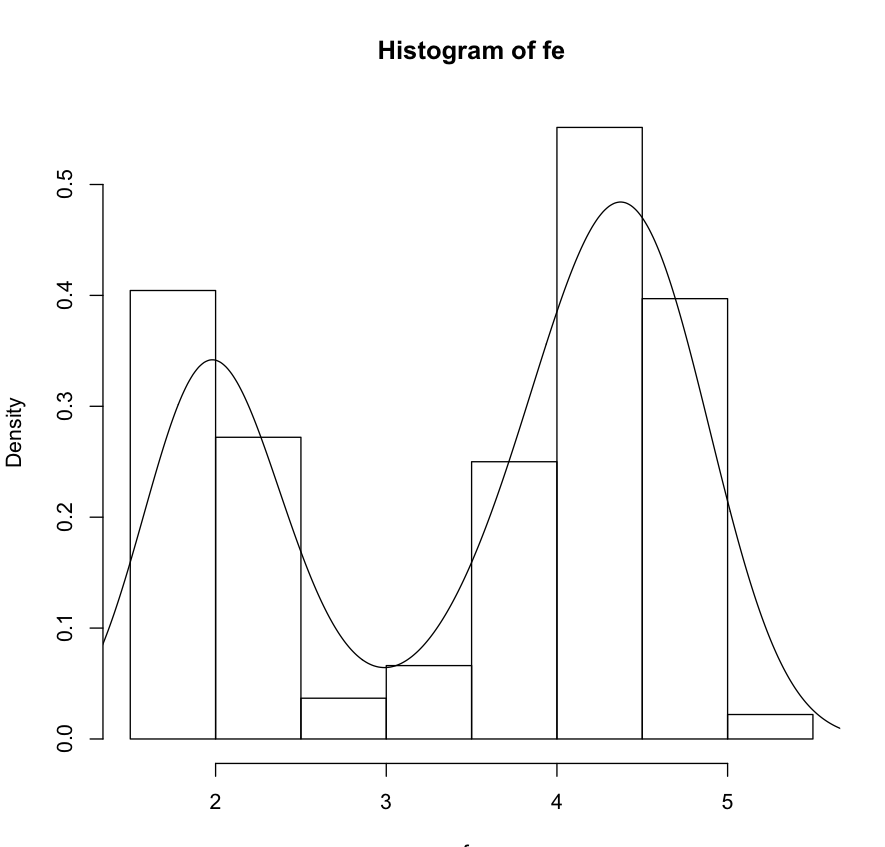
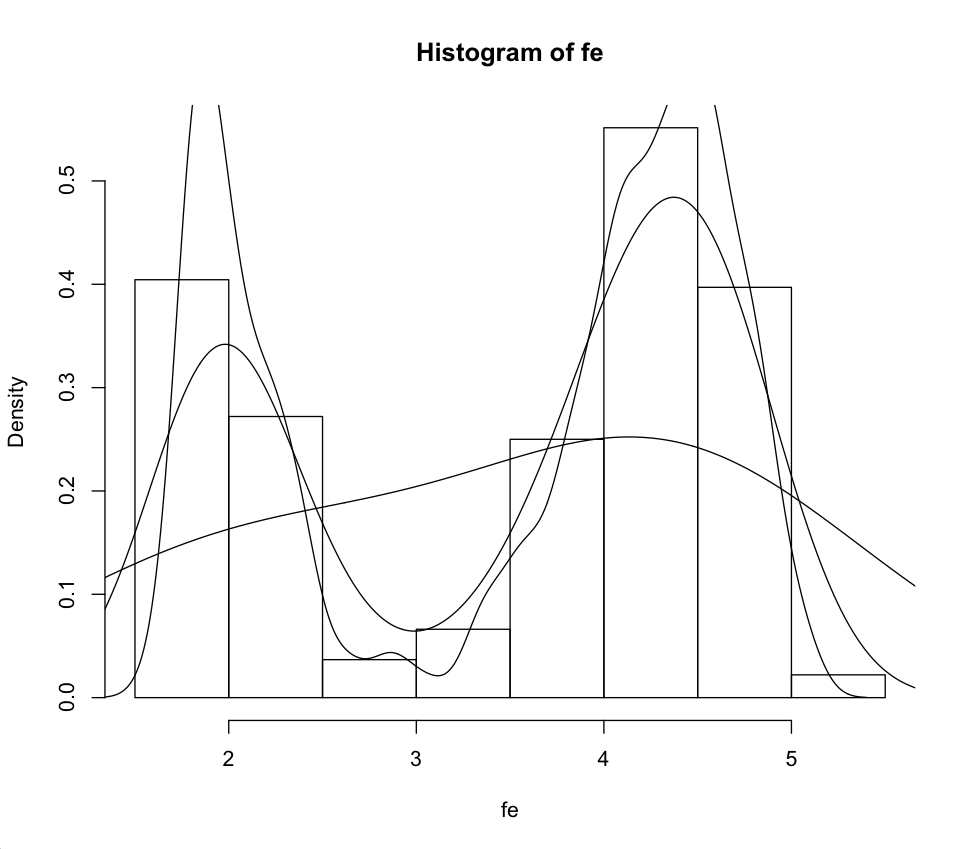
Kernel推定の窓を変えると推定が変化する。
窓(bw=band width)を広げるほど大雑把な推定になり、窓を狭めるほどブレの大きい推定になる。
> fe.d <- density(fe)
> fe.d1 <- density(fe, bw = 0.1)
> fe.d2 <- density(fe, bw = 1)
> hist(fe, freq = FALSE)
> lines(fe.d)
> lines(fe.d1)
> lines(fe.d2)
>
[参照 http://d.hatena.ne.jp/tsutatsutatsuta/20120928/1348801089 ]