この記事は呉高専エンジニア勉強会 Advent Calendar 2017の16日目の記事です。
こんにちは、呉高専専攻科のちゃんゆーです。
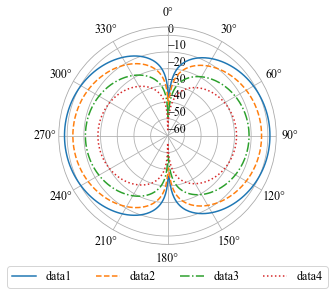
僕の隣の研究室は日本トップクラスの電磁波の研究をしてて「ほげー」って感じで見ているのですが、話を聞くと指向性のグラフを、Excelなんかを駆使して何重にもレイヤーを重ねて、手作業で作っているとのことでした。
「こんなんPython使えば一発でしょ」と思って簡単なスクリプト書いたらほんとに一発でできたお話です。
環境
$ cat requirements.txt

appnope==0.1.0
bleach==2.1.1
cycler==0.10.0
decorator==4.1.2
entrypoints==0.2.3
html5lib==1.0b10
ipykernel==4.6.1
ipython==6.2.1
ipython-genutils==0.2.0
ipywidgets==7.0.1
jedi==0.11.0
Jinja2==2.9.6
jsonschema==2.6.0
jupyter==1.0.0
jupyter-client==5.1.0
jupyter-console==5.2.0
jupyter-core==4.3.0
MarkupSafe==1.0
matplotlib==2.1.0
mistune==0.7.4
nbconvert==5.3.1
nbformat==4.4.0
notebook==5.2.0
numpy==1.13.3
pandas==0.20.3
pandocfilters==1.4.2
parso==0.1.0
pexpect==4.2.1
pickleshare==0.7.4
prompt-toolkit==1.0.15
ptyprocess==0.5.2
Pygments==2.2.0
pyparsing==2.2.0
python-dateutil==2.6.1
pytz==2017.2
pyzmq==16.0.2
qtconsole==4.3.1
simplegeneric==0.8.1
six==1.11.0
terminado==0.6
testpath==0.3.1
tornado==4.5.2
traitlets==4.3.2
wcwidth==0.1.7
webencodings==0.5.1
widgetsnbextension==3.0.3
もしかしたらいらないのも混ざっているかもしれない。
要は jupyter 、 pandas 、 numpy と matplotlib を使います。
jupyter notebookの起動
$ jupyter notebook
これでブラウザが勝手に起動して、jupyter notebookが使えるようになります。
実装
前提
csvのヘッダーは
Phi [deg],data1,data2,data3,data4
このようになっておりました。
実験によっては data5, data6... となるそうです。
データ数が増えるのはいいとして、これ指向性だから極座標形式で描画しないといけない。
できるだろうけど文献がほとんどないぞ。がんばろう。
コード
import pandas as pd
import numpy as np
import matplotlib.pyplot as plt

df = pd.read_csv('sample.csv')

deg = df['Phi [deg]']
values = df.iloc[:, 1:]

lines = ['-', '--', '-.', ':', '.', ',']

ax = plt.subplot(111, projection='polar')

ax.axes.set_theta_zero_location('N')
ax.set_theta_direction(-1)
ax.set_rlabel_position(0)
ax.set_xticks(np.pi/180. * np.linspace(0,  360, 12, endpoint=False))

ax.spines['polar'].set_color('darkgray')

plt.rcParams['font.family'] = 'Times New Roman'
plt.rcParams['font.size'] = 12

plt.ylim(-60.1, 5)

theta = deg*np.pi/180
r = values

for i in range(len(values.columns)):
    label = values.columns[i]
    line = lines[i%len(lines)]
    ax.plot(theta, values.iloc[:, i], line, label=label)

plt.legend(bbox_to_anchor=(0.5, -0.15),  ncol=len(values.columns), loc='center')
plt.savefig('sample.png', dpi=500, bbox_inches='tight')
plt.show()
がんばった。
殴り書きみたいな感じですが、 sample.csv を読み込んでうまい具合にグラフを描画してくれて sample.png が書き出されます。
結果
こんな感じで表示されました。わーい。
なんか自分も電磁波のプロフェッショナルになった気分♪
その後とまとめ
その研究室の人に見てもらって、めっちゃ喜んでもらいました。
が、実用上は、論文用にモノクロ出力しないといけないとか、凡例の位置の調整をしないといけないとかで、その都度プログラム修正しないといけないので、実際に使われることはありませんでした。
そのあたりまで作り込んで、全てWeb上で完結するシステム構築すれば1万円くらいで売れたんじゃないかと思ってます。笑
ざんねん。
とはいえ、よいpandasとmatplotlibの復習の機会になったんで感謝です!
