この記事はこちらの記事の続きになります。もしよかったらこちらも読んでいただけると嬉しいです。
基本的なSortをmatplotlibでアニメーションにしてみた
tl;dr
- Matplotlibを使ってBarにgradation colormapを反映し、Animationを使って動かしています。gradationは各Barに対してColor imageをFillするというやり方です。
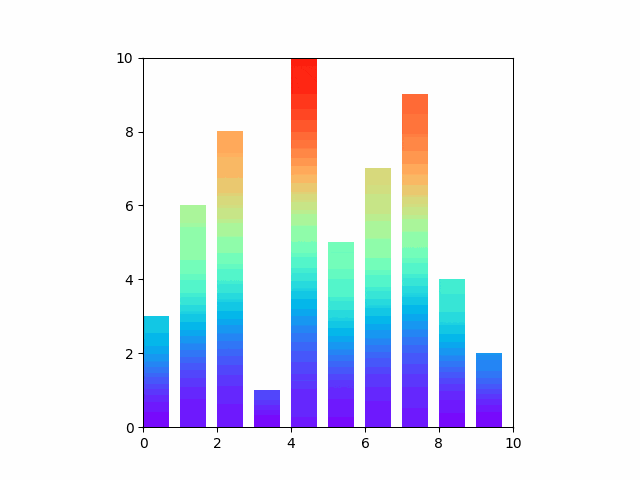
- defaultはX軸に対して、Gradation Colorとなるため、Barのheightに対してGradation colorにする場合は、各barのheightに対して、Color mapを対応させるようにしています。
- Normalizeを無効化し、heightの最大値を基準としています。
- array-like という概念を初めて知りました。配列と何が違うのかは今後勉強します。
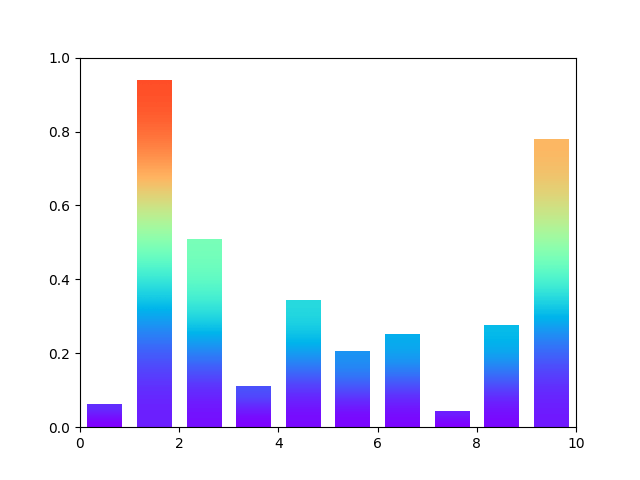
step 1 Barへの色付け
import numpy as np
import matplotlib.pyplot as plt

def gradient_image(ax, extent, direction=0, cmap_range=(0, 1), **kwargs):
    phi = direction * np.pi / 2
    v = np.array([np.cos(phi), np.sin(phi)])
    X = np.array([[v @ [1, 0], v @ [1, 1]],
                [v @ [0, 0], v @ [0, 1]]])
    a, b = cmap_range
    X = a + (b - a) / X.max()*X
    im = ax.imshow(X, extent=extent, interpolation='bicubic', norm = plt.cm.colors.NoNorm(vmin = 0, vmax = 1), **kwargs)
    return im

def gradient_bar(ax, x, y, width=0.5, bottom=0):
    for left, top in zip(x, y):
        right = left + width
        gradient_image(ax, extent=(left, right, bottom, top), cmap=plt.cm.get_cmap('rainbow'), cmap_range=(0, top))

xmin, xmax = xlim = 0, 10
ymin, ymax = ylim = 0, 1

fig, ax = plt.subplots()
ax.set(xlim=xlim, ylim=ylim, autoscale_on=False)

x, y = [], []

ax.set_aspect('auto')

N = 10
x = np.arange(N) + 0.15
y = np.random.rand(N)
gradient_bar(ax, x, y, width=0.7)
ax.set_aspect('auto')
plt.show()
step 2 Barへの色付け x Animation

import numpy as np
import matplotlib.pyplot as plt
from matplotlib.animation import FuncAnimation, writers
from sort_function_for_visualization import insert_sort, bubble_sort, quick_sort, merge_sort
from functools import partial

def gradient_image(ax, extent, direction=0, cmap_range=(0, 1), **kwargs):
    phi = direction * np.pi / 2
    v = np.array([np.cos(phi), np.sin(phi)])
    X = np.array([[v @ [1, 0], v @ [1, 1]],
                [v @ [0, 0], v @ [0, 1]]])
    a, b = cmap_range
    X = a + (b - a) / X.max()*X
    im = ax.imshow(X, extent=extent, interpolation='bicubic', norm = plt.cm.colors.NoNorm(vmin = 0, vmax = 1), **kwargs)
    return im

def gradient_bar(ax, x, y, width=0.5, bottom=0):
    n = len(x)
    for left, top in zip(x, y):
        right = left + width
        gradient_image(ax, extent=(left, right, bottom, top), cmap=plt.cm.get_cmap('rainbow'), cmap_range=(0, top/n))


n = 10
# 重複データが出ないように変更
data = [i for i in range(1,n+1)]
np.random.shuffle(data)

generator = bubble_sort(data)
sort_name = "bubble_sort"

fig, ax = plt.subplots()

font = {'family':'serif','color':'blue','size':20}
plt.title(sort_name, fontdict = font)

operation = [0]

xmin, xmax = xlim = 0, 10
ymin, ymax = ylim = 0, 10

ax.set(xlim=xlim, ylim=ylim, autoscale_on=False)

def update(frame):
    ax.cla()
    ax.set(xlim=xlim, ylim=ylim, autoscale_on=False)
    x = range(len(data))
    y = data
    ax.text(0.01, 0.95, "", transform = ax.transAxes).set_text("operations : {}".format(operation[0]))
    gradient_bar(ax, x, y, width=0.7)
    operation[0] += 1


anim = FuncAnimation(fig, partial(update), frames=generator, interval=300, repeat=False, save_count=100)

#anim.save('animationWithoutNormalize.gif')
plt.show()
別Ver。こちらは単色のbarです。Heightによって色を変えています。


参考
-
matplotlib Bar chart with gradients
https://matplotlib.org/stable/gallery/lines_bars_and_markers/gradient_bar.html -
matplotlib.pyplot.bar
https://matplotlib.org/stable/api/_as_gen/matplotlib.pyplot.bar.html#matplotlib-pyplot-bar -
matplotlib.animation
https://matplotlib.org/stable/api/animation_api.html -
Colormap normalization
https://matplotlib.org/stable/tutorials/colors/colormapnorms.html