背景
PrometheusをDockerで利用しようとしていた
作り直すたびに監視データも初期化されるため、データ永続化をしたい
対象環境
> docker-compose version
docker-compose version 1.23.2, build 1110ad01
docker-py version: 3.6.0
CPython version: 3.6.6
OpenSSL version: OpenSSL 1.1.0h  27 Mar 2018
> docker image ls
REPOSITORY                   TAG                 IMAGE ID            CREATED             SIZE
prom/prometheus              v2.6.1              5517f7057e72        9 days ago          97.8MB
ちなみに、本記事で利用するコードはこちらにあります
方法
/etc/prometheus/data がローカルストレージになっている
> docker-compose exec prometheus ls -la /etc/prometheus
total 12
drwxr-xr-x    1 nobody   nogroup       4096 Jan 25 03:00 .
drwxr-xr-x    1 root     root          4096 Jan 25 06:04 ..
lrwxrwxrwx    1 nobody   nogroup         39 Jan 15 20:13 console_libraries -> /usr/share/prometheus/console_libraries
lrwxrwxrwx    1 nobody   nogroup         31 Jan 15 20:13 consoles -> /usr/share/prometheus/consoles/
lrwxrwxrwx    1 root     root            11 Jan 15 20:13 data -> /prometheus
-rw-r--r--    1 root     root           682 Jan 24 06:48 prometheus.yml
> docker-compose exec prometheus ls -la /etc/prometheus/data/
total 4
drwxr-xr-x    5 nobody   nogroup        170 Jan 25 06:01 .
drwxr-xr-x    1 root     root          4096 Jan 25 06:04 ..
drwxr-xr-x    4 nobody   nogroup        136 Jan 25 03:19 data
-rw-r--r--    1 nobody   nogroup          0 Jan 25 06:01 lock
drwxr-xr-x    3 nobody   nogroup        102 Jan 25 06:01 wal
なので、こいつをローカルの適当なdataディレクトリとマウントしてあげれば、良い
そのときのdocker-compose.ymlとDockerfileとprometheus.ymlは下記となる
docker-compose.yml
version: '2'
services:
  prometheus:
    build: .
    ports:
     - "9090:9090"
    volumes:
     - $PWD/prometheus-data:/etc/prometheus/data
FROM prom/prometheus
ADD prometheus.yml /etc/prometheus/
prometheus.yml
global:
  scrape_interval: 15s
  external_labels:
    monitor: 'codelab-monitor'
scrape_configs:
  - job_name: 'prometheus'
    scrape_interval: 5s
    static_configs:
      - targets: ['localhost:9090']
これで下記のコマンドで起動します
> docker-compose up -d
Creating network "prometheus-test_default" with the default driver
Creating prometheus-test_prometheus_1 ... done
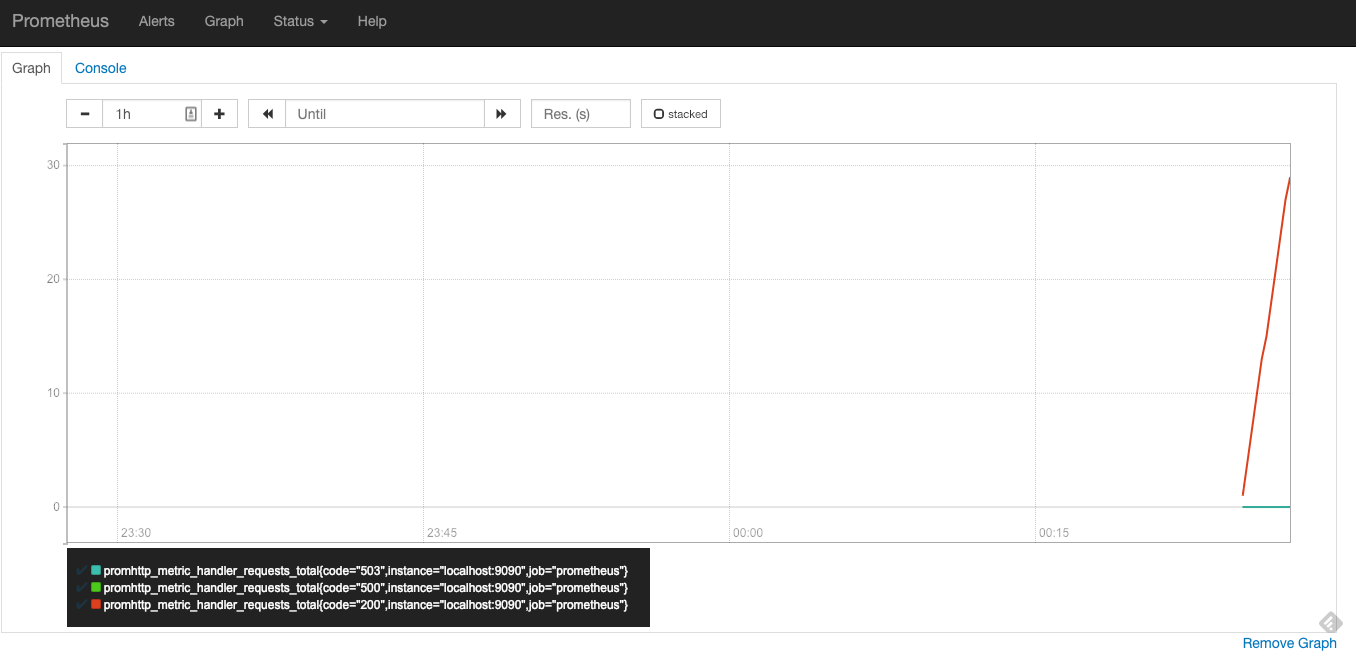
グラフ(httpリクエスト合計)を見ると、正しく起動でき、グラフが上昇しているのがわかります
ここから、コンテナを落として、再度起動してみます
> docker-compose down
Stopping prometheus-test_prometheus_1 ... done
Removing prometheus-test_prometheus_1 ... done
Removing network prometheus-test_default
> docker-compose up -d
Creating network "prometheus-test_default" with the default driver
Creating prometheus-test_prometheus_1 ... done
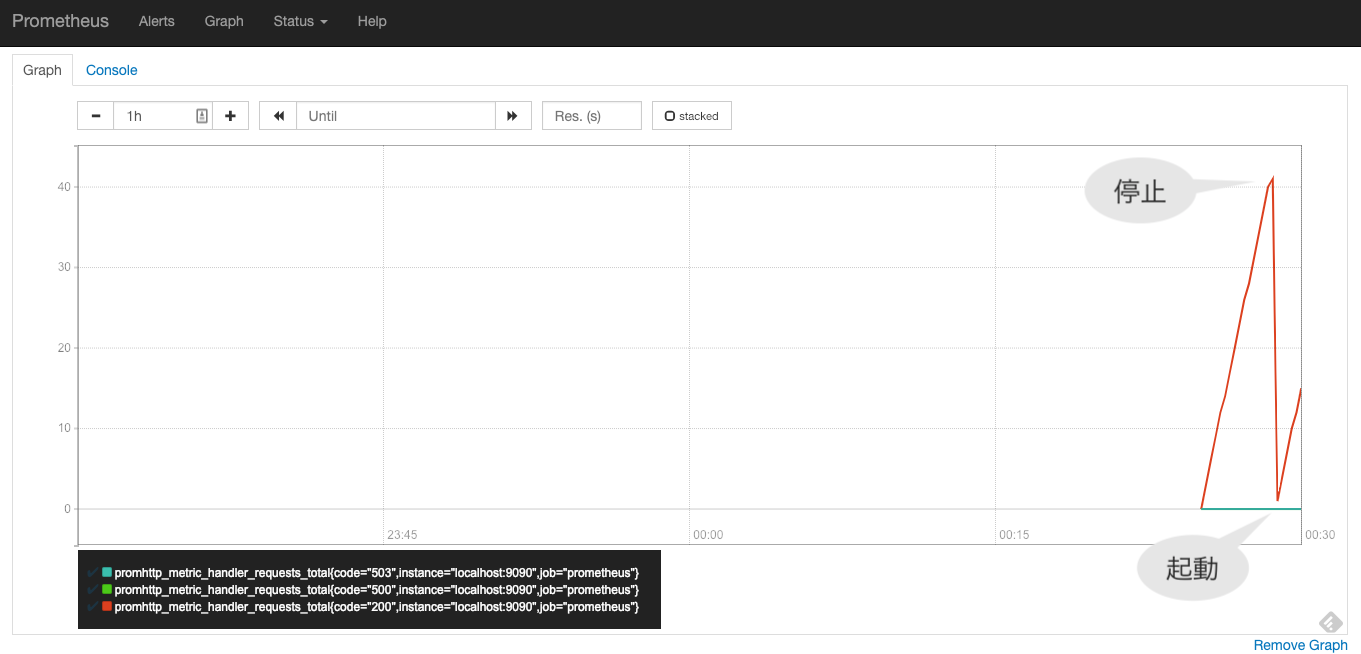
すると、下記のように一度コンテナを落とした時のグラフも見えるようになります
失敗談
下記2点をダブルで行っていて、
- prometheus.ymlをDockerfileでADDしたものをbuild
-
/etc/prometheus/をカレントディレクトリとマウント
ビルドで追加したymlがマウントしたせいで削除されてしまい、起動時にprometheus.ymlが見当たらずにエラーが出ちゃって小一時間悩んでた
> docker-compose up
Creating network "prometheus-test_default" with the default driver
Creating prometheus-test_prometheus_1 ... done
Attaching to prometheus-test_prometheus_1
prometheus_1  | level=info ts=2019-01-25T03:19:16.5079408Z caller=main.go:243 msg="Starting Prometheus" version="(version=2.6.1, branch=HEAD, revision=b639fe140c1f71b2cbad3fc322b17efe60839e7e)"
prometheus_1  | level=info ts=2019-01-25T03:19:16.5080482Z caller=main.go:244 build_context="(go=go1.11.4, user=root@4c0e286fe2b3, date=20190115-19:12:04)"
prometheus_1  | level=info ts=2019-01-25T03:19:16.5080827Z caller=main.go:245 host_details="(Linux 4.9.125-linuxkit #1 SMP Fri Sep 7 08:20:28 UTC 2018 x86_64 433cf28249ba (none))"
prometheus_1  | level=info ts=2019-01-25T03:19:16.5082197Z caller=main.go:246 fd_limits="(soft=1048576, hard=1048576)"
prometheus_1  | level=info ts=2019-01-25T03:19:16.5088957Z caller=main.go:247 vm_limits="(soft=unlimited, hard=unlimited)"
prometheus_1  | level=info ts=2019-01-25T03:19:16.5120108Z caller=main.go:561 msg="Starting TSDB ..."
prometheus_1  | level=info ts=2019-01-25T03:19:16.5125678Z caller=web.go:429 component=web msg="Start listening for connections" address=0.0.0.0:9090
prometheus_1  | level=info ts=2019-01-25T03:19:16.5382688Z caller=main.go:571 msg="TSDB started"
prometheus_1  | level=info ts=2019-01-25T03:19:16.5388817Z caller=main.go:631 msg="Loading configuration file" filename=prometheus.yml
prometheus_1  | level=info ts=2019-01-25T03:19:16.539723Z caller=main.go:430 msg="Stopping scrape discovery manager..."
prometheus_1  | level=info ts=2019-01-25T03:19:16.5398383Z caller=main.go:444 msg="Stopping notify discovery manager..."
prometheus_1  | level=info ts=2019-01-25T03:19:16.540191Z caller=main.go:466 msg="Stopping scrape manager..."
prometheus_1  | level=info ts=2019-01-25T03:19:16.5409244Z caller=main.go:440 msg="Notify discovery manager stopped"
prometheus_1  | level=info ts=2019-01-25T03:19:16.5410353Z caller=main.go:426 msg="Scrape discovery manager stopped"
prometheus_1  | level=info ts=2019-01-25T03:19:16.5411454Z caller=main.go:460 msg="Scrape manager stopped"
prometheus_1  | level=info ts=2019-01-25T03:19:16.5413125Z caller=manager.go:664 component="rule manager" msg="Stopping rule manager..."
prometheus_1  | level=info ts=2019-01-25T03:19:16.5416848Z caller=manager.go:670 component="rule manager" msg="Rule manager stopped"
prometheus_1  | level=info ts=2019-01-25T03:19:16.5489596Z caller=notifier.go:521 component=notifier msg="Stopping notification manager..."
prometheus_1  | level=info ts=2019-01-25T03:19:16.5493186Z caller=main.go:615 msg="Notifier manager stopped"
prometheus_1  | level=error ts=2019-01-25T03:19:16.5501995Z caller=main.go:624 err="error loading config from \"prometheus.yml\": couldn't load configuration (--config.file=\"prometheus.yml\"): open prometheus.yml: no such file or directory"
prometheus-test_prometheus_1 exited with code 1