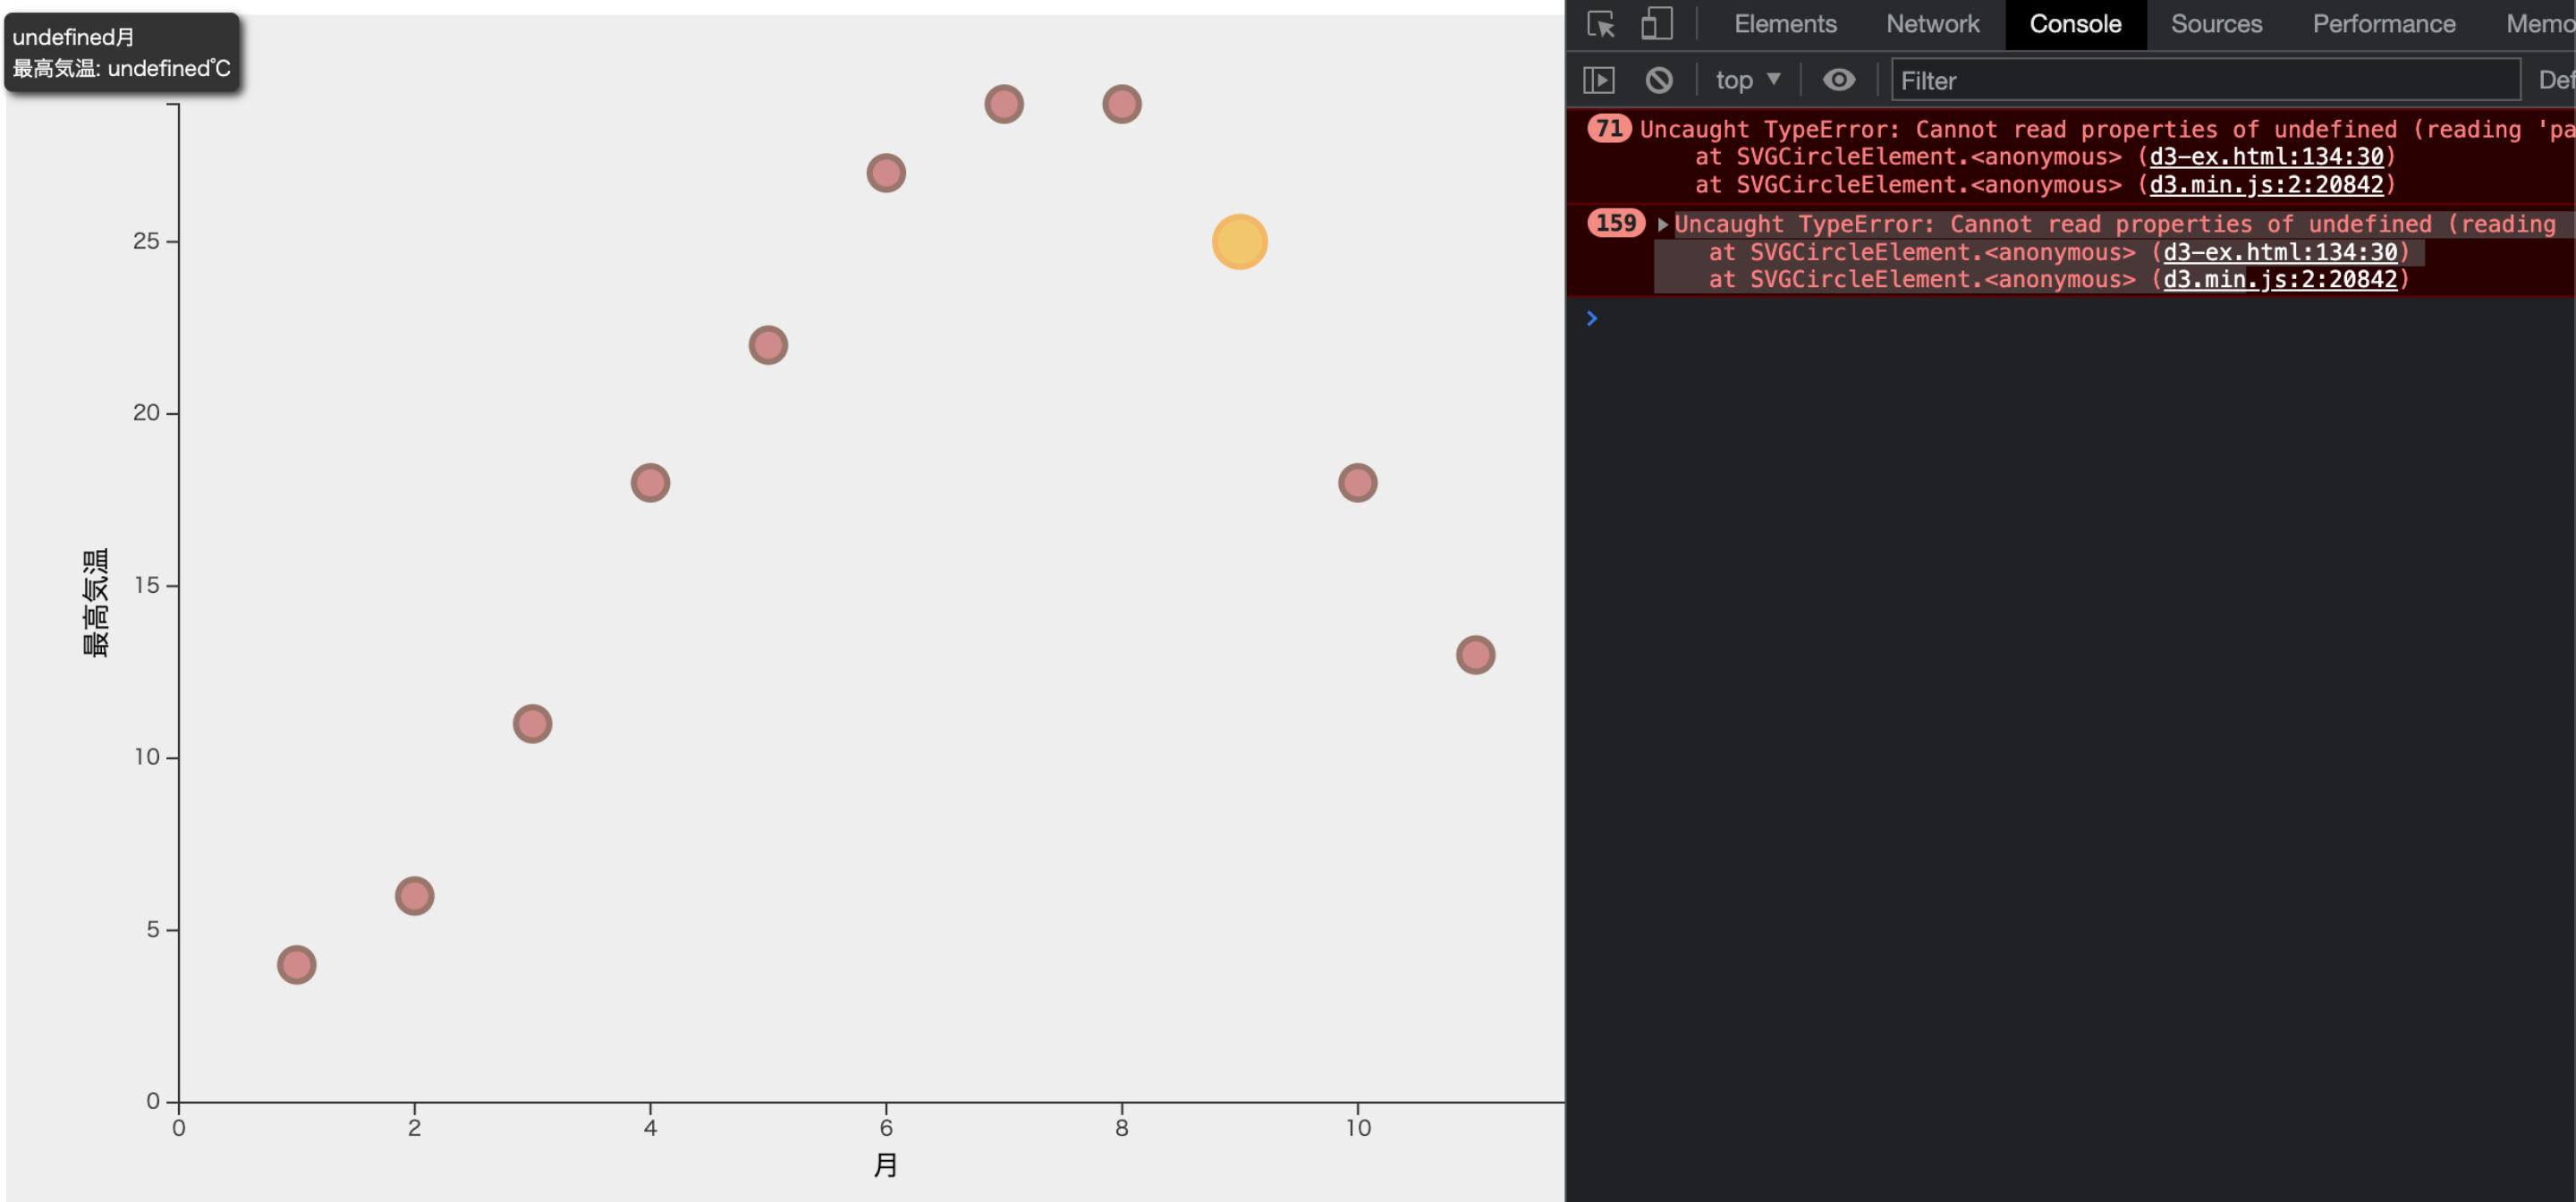
問題
古いバージョンの書き方だと mousemove で座標が取れない
Uncaught TypeError: Cannot read properties of undefined (reading 'pageY')
解決 – コード例
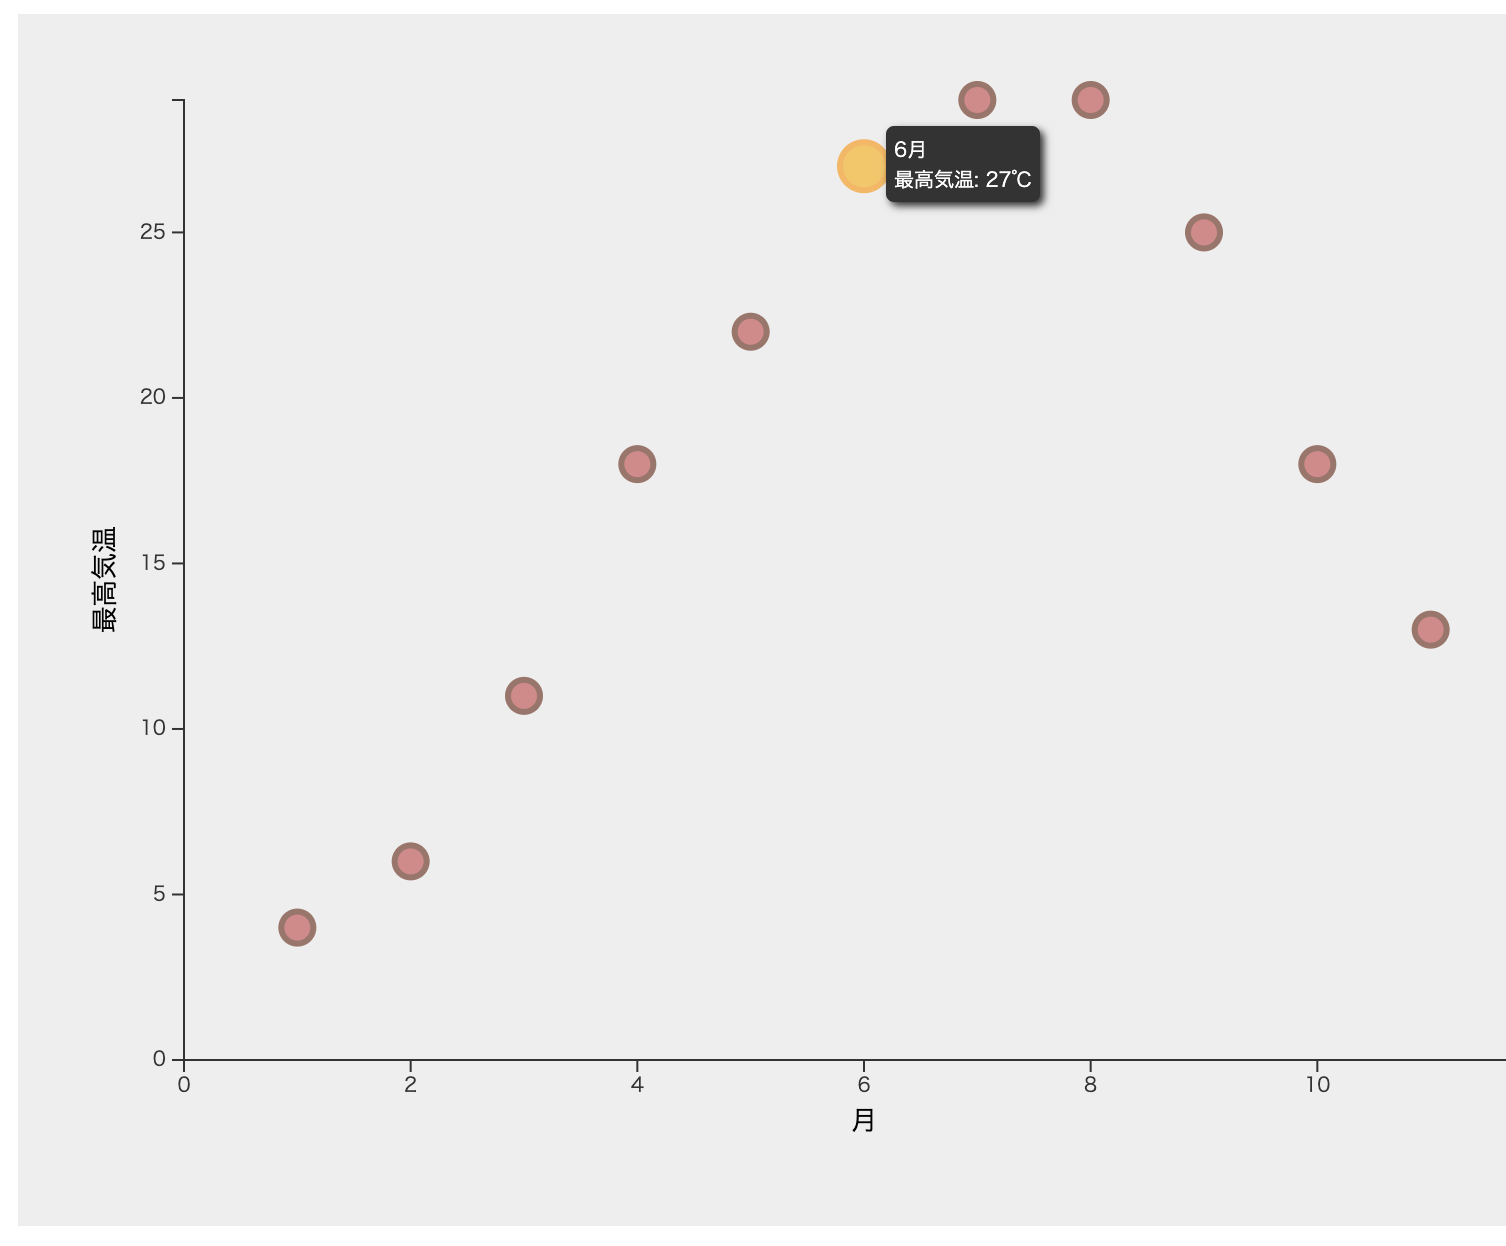
新しいバージョンに対応した書き方にすると動いた
ほぼ参考サイトのままのコードだが、以下の箇所を変えた。
- mouseover では第2引数でdataを受け取る
- mousemove では d3インスタンスからではなくevent情報から座標を得る
<!DOCTYPE html>
<html>

<head>
  <meta charset="utf-8">
  <style>
    svg {
      font: 10px sans-serif;
      background-color: #eee;
      text-align: right;
      padding: 3px;
      margin: 1px;
      color: #333;
    }

    .cirStyle {
      r: 8;
      fill: #BF5E5E;
      stroke-width: 3px;
      stroke: #73412F;
      opacity: 0.7;
    }

    .cirStyle:hover {
      r: 12;
      fill: #F2B705;
      stroke: #F29F05;
    }

    .tooltip {
      position: absolute;
      width: auto;
      height: auto;
      padding: 4px;
      font: 10px sans-serif;
      color: #fff;
      background: #333;
      -webkit-box-shadow: 2px 2px 4px rgba(0, 0, 0, 0.8);
      -moz-box-shadow: 2px 2px 4px rgba(0, 0, 0, 0.8);
      box-shadow: 2px 2px 4px rgba(0, 0, 0, 0.8);
      border-radius: 4px;
      visibility: hidden;
    }
  </style>
  <script src="https://cdnjs.cloudflare.com/ajax/libs/d3/7.8.2/d3.min.js"></script>

</head>

<body>
  <script>
    // 1. データの準備
    var dataset = [
      [1, 4],
      [2, 6],
      [3, 11],
      [4, 18],
      [5, 22],
      [6, 27],
      [7, 29],
      [8, 29],
      [9, 25],
      [10, 18],
      [11, 13],
      [12, 7],
    ];

    var width = 800; // グラフの横幅
    var height = 600; // グラフの縦幅
    var margin = { "top": 40, "bottom": 80, "right": 40, "left": 80 };

    // tooltip用div要素追加
    var tooltip = d3.select("body").append("div").attr("class", "tooltip");

    // SVGの設定
    var svg = d3.select("body").append("svg").attr("width", width).attr("height", height);

    // x,y軸スケールの設定
    var xScale = d3.scaleLinear()
      .domain([0, d3.max(dataset, function (d) { return d[0]; })])
      .range([margin.left, width - margin.right]);

    var yScale = d3.scaleLinear()
      .domain([0, d3.max(dataset, function (d) { return d[1]; })])
      .range([height - margin.bottom, margin.top]);

    // 軸の表示
    var axisx = d3.axisBottom(xScale).ticks(5);
    var axisy = d3.axisLeft(yScale).ticks(5);

    svg.append("g")
      .attr("transform", "translate(" + 0 + "," + (height - margin.bottom) + ")")
      .call(axisx)
      .append("text")
      .attr("fill", "black")
      .attr("x", (width - margin.left - margin.right) / 2 + margin.left)
      .attr("y", 35)
      .attr("text-anchor", "middle")
      .attr("font-size", "10pt")
      .attr("font-weight", "middle")
      .text("月");

    svg.append("g")
      .attr("transform", "translate(" + margin.left + "," + 0 + ")")
      .call(axisy)
      .append("text")
      .attr("fill", "black")
      .attr("text-anchor", "middle")
      .attr("x", -(height - margin.top - margin.bottom) / 2 - margin.top)
      .attr("y", -35)
      .attr("transform", "rotate(-90)")
      .attr("font-weight", "middle")
      .attr("font-size", "10pt")
      .text("最高気温");

    // ラインの表示
    svg.append("g")
      .selectAll("circle")
      .data(dataset)
      .enter()
      .append("circle")
      .attr("cx", function (d) { return xScale(d[0]); })
      .attr("cy", function (d) { return yScale(d[1]); })
      .attr("r", 4)
      .attr("id", function (d, i) { return "id-" + i; })
      .classed("cirStyle", true)
      // タッチイベント設定
      // 第2引数でdataを受け取る
      .on("mouseover", function (event, data) {
        //  tooltip
        //  .style("visibility", "visible")
        //  .html(d[0] + "月" + "<br>最高気温: " + d[1] + "℃");
        tooltip
          .style("visibility", "visible")
          .html(data[0] + "月" + "<br>最高気温: " + data[1] + "℃");
      })
      // d3インスタンスからではなくevent情報から座標を得る
      .on("mousemove", function (event) {
        // tooltip
        // .style("top", (d3.event.pageY - 20) + "px")
        // .style("left", (d3.event.pageX + 10) + "px");

        tooltip
          .style("top", (event.pageY - 20) + "px")
          .style("left", (event.pageX + 10) + "px");
      })
      .on("mouseout", function (d) {
        tooltip.style("visibility", "hidden");
      })
  </script>
</body>

</html>
表示例
参考
チャットメンバー募集
何か質問、悩み事、相談などあればLINEオープンチャットもご利用ください。