はじめに
この記事では、React 向けコンポーネントライブラリである Mantine に含まれるチャート(グラフ)機能の MantineCharts でチャートのX軸・Y軸をカスタマイズする方法を記載します。
開発環境
開発環境は以下の通りです。
- Windows 11
- Next.js 14.2.4
- React 18.3.1
- TypeScript 5.5.2
- @mantine/core 7.13.2
- @mantine/hooks 7.13.2
- @mantine/charts 7.13.2
- Recharts 2.13.0
事前準備
X軸・Y軸のラベルのカスタマイズの前に2点事前準備をします。
MantineCharts の利用準備
Next.js で MantineCharts を利用できるようにしておきます。
詳しい手順は以下の記事に記載しています。
スキャッターチャートを実装する
カスタマイズ対象のチャートとして、シンプルなスキャッターチャート(散布図)を実装します。
表示するデータは以下の通りです。
data
export const data = [
  {
    color: "blue.5",
    name: "Group 1",
    data: [
      { age: 25, BMI: 20 },
      { age: 30, BMI: 22 },
      { age: 35, BMI: 18 },
      { age: 40, BMI: 25 },
      { age: 45, BMI: 30 },
      { age: 28, BMI: 15 },
      { age: 22, BMI: 12 },
      { age: 50, BMI: 28 },
      { age: 32, BMI: 19 },
      { age: 48, BMI: 31 },
      { age: 26, BMI: 24 },
      { age: 38, BMI: 27 },
      { age: 42, BMI: 29 },
      { age: 29, BMI: 16 },
      { age: 34, BMI: 23 },
      { age: 44, BMI: 33 },
      { age: 23, BMI: 14 },
      { age: 37, BMI: 26 },
      { age: 49, BMI: 34 },
      { age: 27, BMI: 17 },
      { age: 41, BMI: 32 },
      { age: 31, BMI: 21 },
      { age: 46, BMI: 35 },
      { age: 24, BMI: 13 },
      { age: 33, BMI: 22 },
      { age: 39, BMI: 28 },
      { age: 47, BMI: 30 },
      { age: 36, BMI: 25 },
      { age: 43, BMI: 29 },
      { age: 21, BMI: 11 },
    ],
  },
  {
    color: "red.5",
    name: "Group 2",
    data: [
      { age: 26, BMI: 21 },
      { age: 31, BMI: 24 },
      { age: 37, BMI: 19 },
      { age: 42, BMI: 27 },
      { age: 29, BMI: 32 },
      { age: 35, BMI: 18 },
      { age: 40, BMI: 23 },
      { age: 45, BMI: 30 },
      { age: 27, BMI: 15 },
      { age: 33, BMI: 20 },
      { age: 38, BMI: 25 },
      { age: 43, BMI: 29 },
      { age: 30, BMI: 16 },
      { age: 36, BMI: 22 },
      { age: 41, BMI: 28 },
      { age: 46, BMI: 33 },
      { age: 28, BMI: 17 },
      { age: 34, BMI: 22 },
      { age: 39, BMI: 26 },
      { age: 44, BMI: 31 },
      { age: 32, BMI: 18 },
      { age: 38, BMI: 23 },
      { age: 43, BMI: 28 },
      { age: 48, BMI: 35 },
      { age: 25, BMI: 14 },
      { age: 31, BMI: 20 },
      { age: 36, BMI: 25 },
      { age: 41, BMI: 30 },
      { age: 29, BMI: 16 },
    ],
  },
];
スキャッターチャートの実装に必要な最低限の props は以下の通りです。
-
h: チャート全体の高さ -
data: チャートに表示するデータ -
dataKey: X軸・Y軸に表示すデータオブジェクトのキー
上記の props を ScatterChart コンポーネントに渡します。
import { ScatterChart } from "@mantine/charts";
import { data } from "./data";

export default function Demo() {
  return <ScatterChart h={400} data={data} dataKey={{ x: "age", y: "BMI" }} />;
}
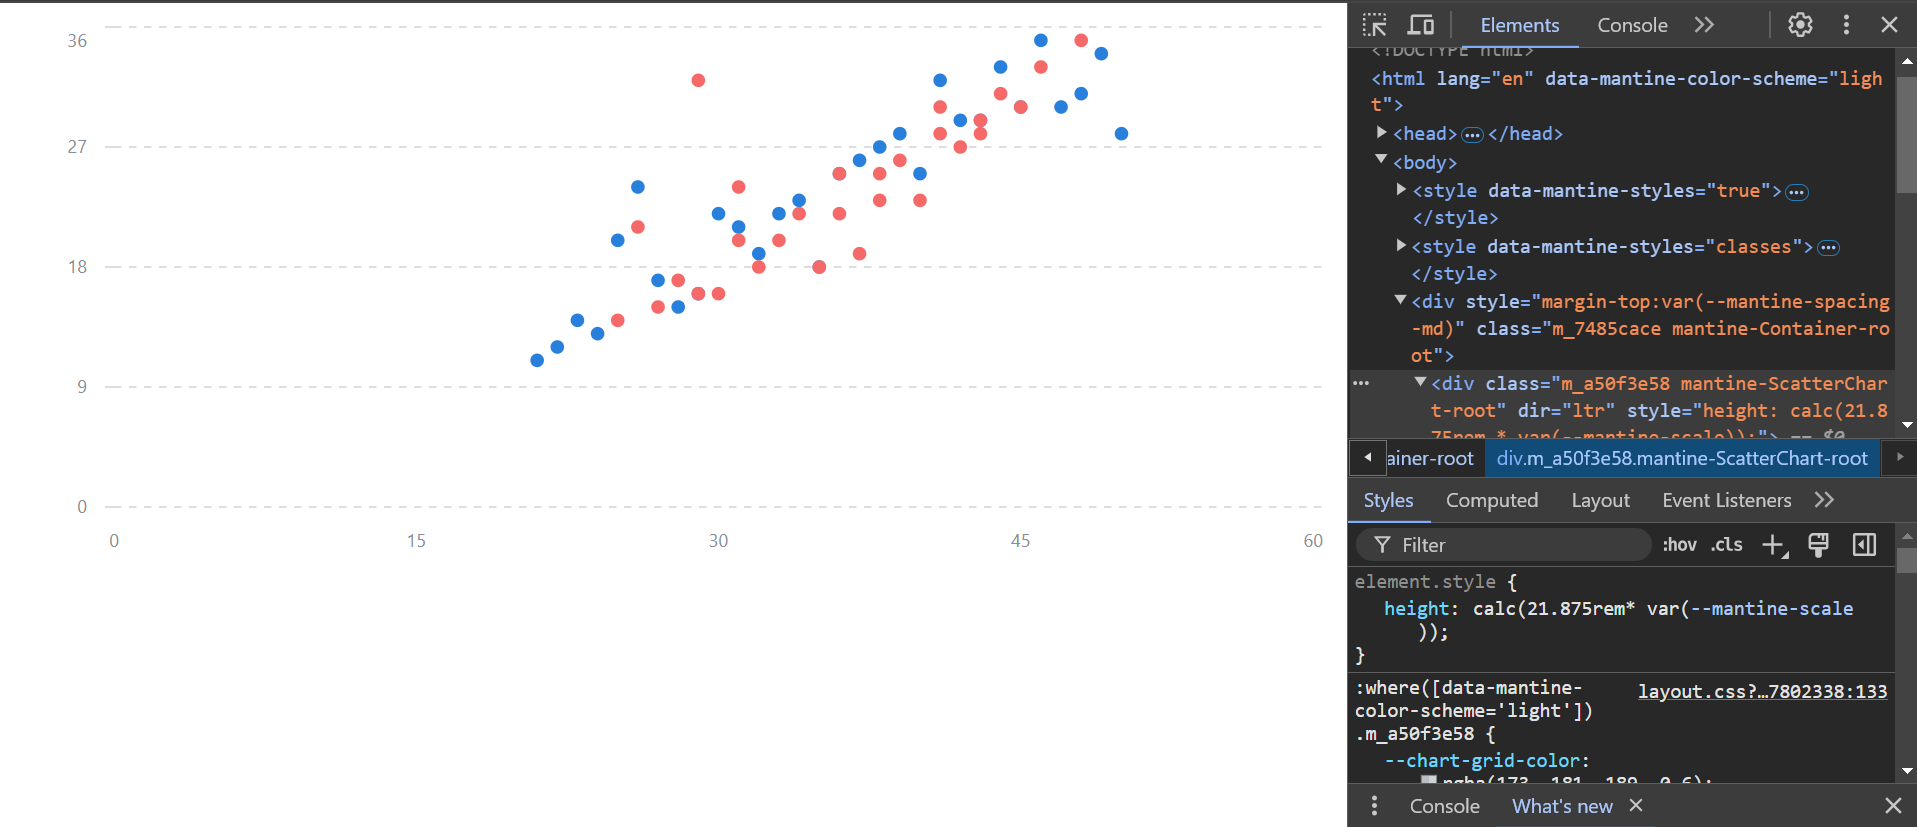
スキャッターチャートが表示されます。
h に渡した 400 は px から rem (25rem) に変換されています。
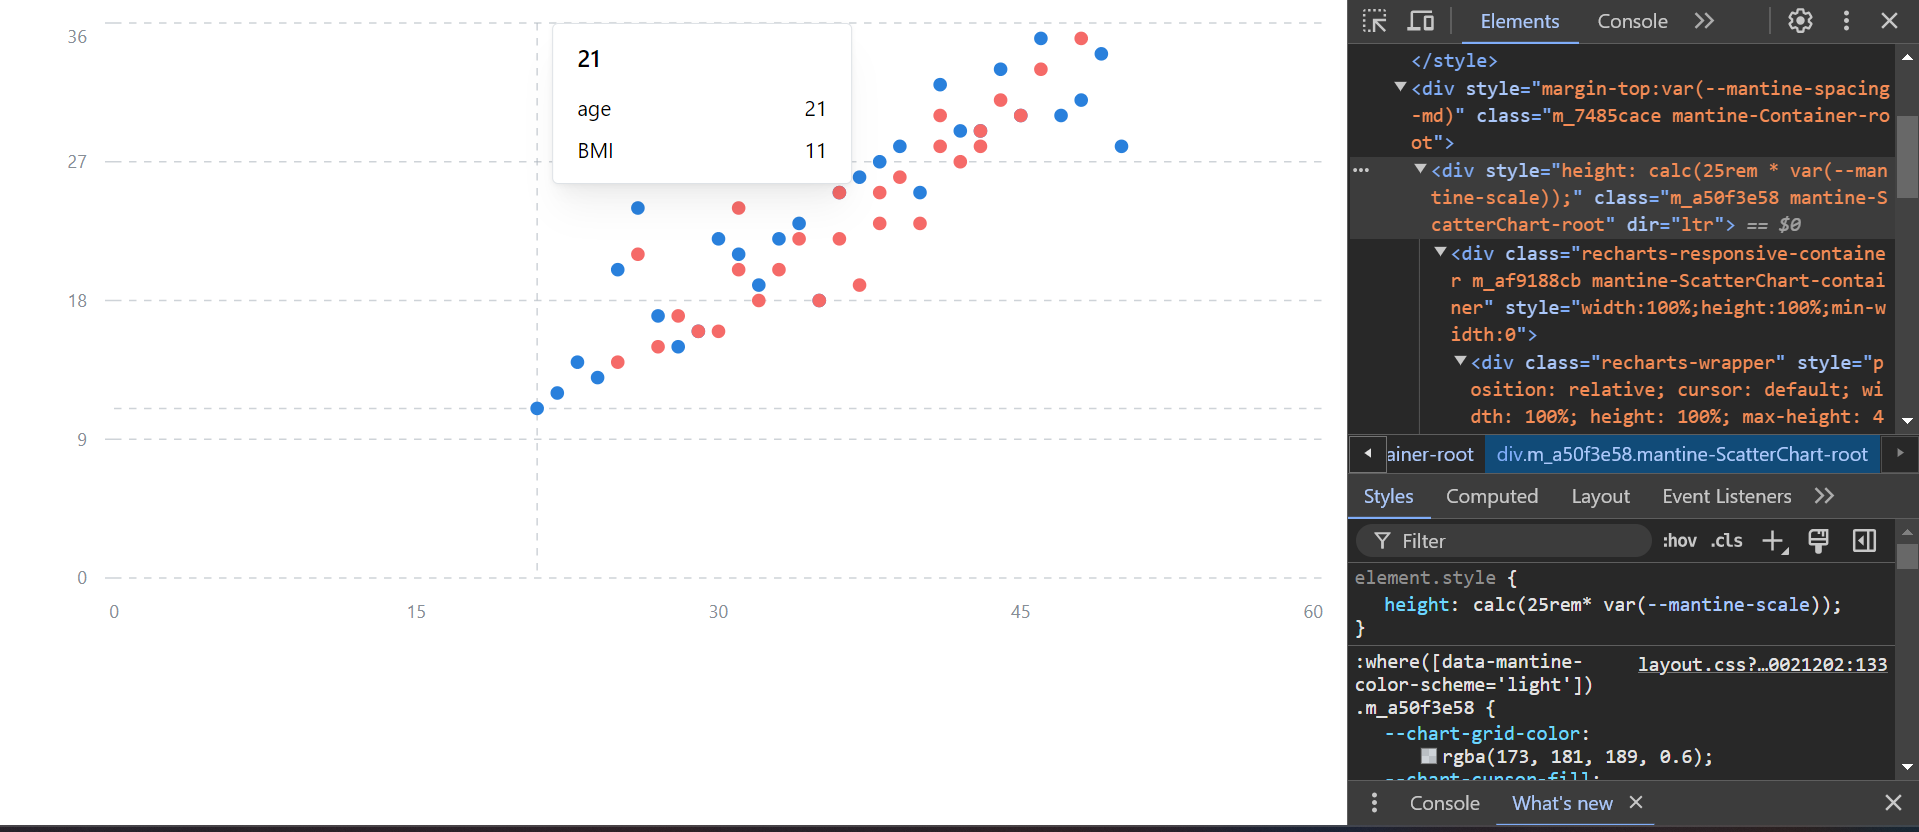
また、ドットにマウスオーバーするとツールチップとX軸・Y軸方向への点線が表示されます。
ツールチップ内には、data の name の値と age、BMI の値が表示されます。
xAxisLabel / yAxisLabel props を利用したカスタマイズ
事前準備ができたので、X軸・Y軸のラベルのカスタマイズ方法を記載します。
まずは xAxisLabel / yAxisLabel props を利用したX軸・Y軸のラベルのカスタマイズ方法を記載します。
X軸・Y軸のラベル表示
xAxisLabel、yAxisLabel に string を渡すと、X軸・Y軸にラベルが表示できます。
import { ScatterChart } from "@mantine/charts";
import { data } from "./data";

export default function Demo() {
  return (
    <ScatterChart
      h={400}
      w={600}
      data={data}
      dataKey={{ x: "age", y: "BMI" }}
      xAxisLabel="age"
      yAxisLabel="BMI"
    />
  );
}
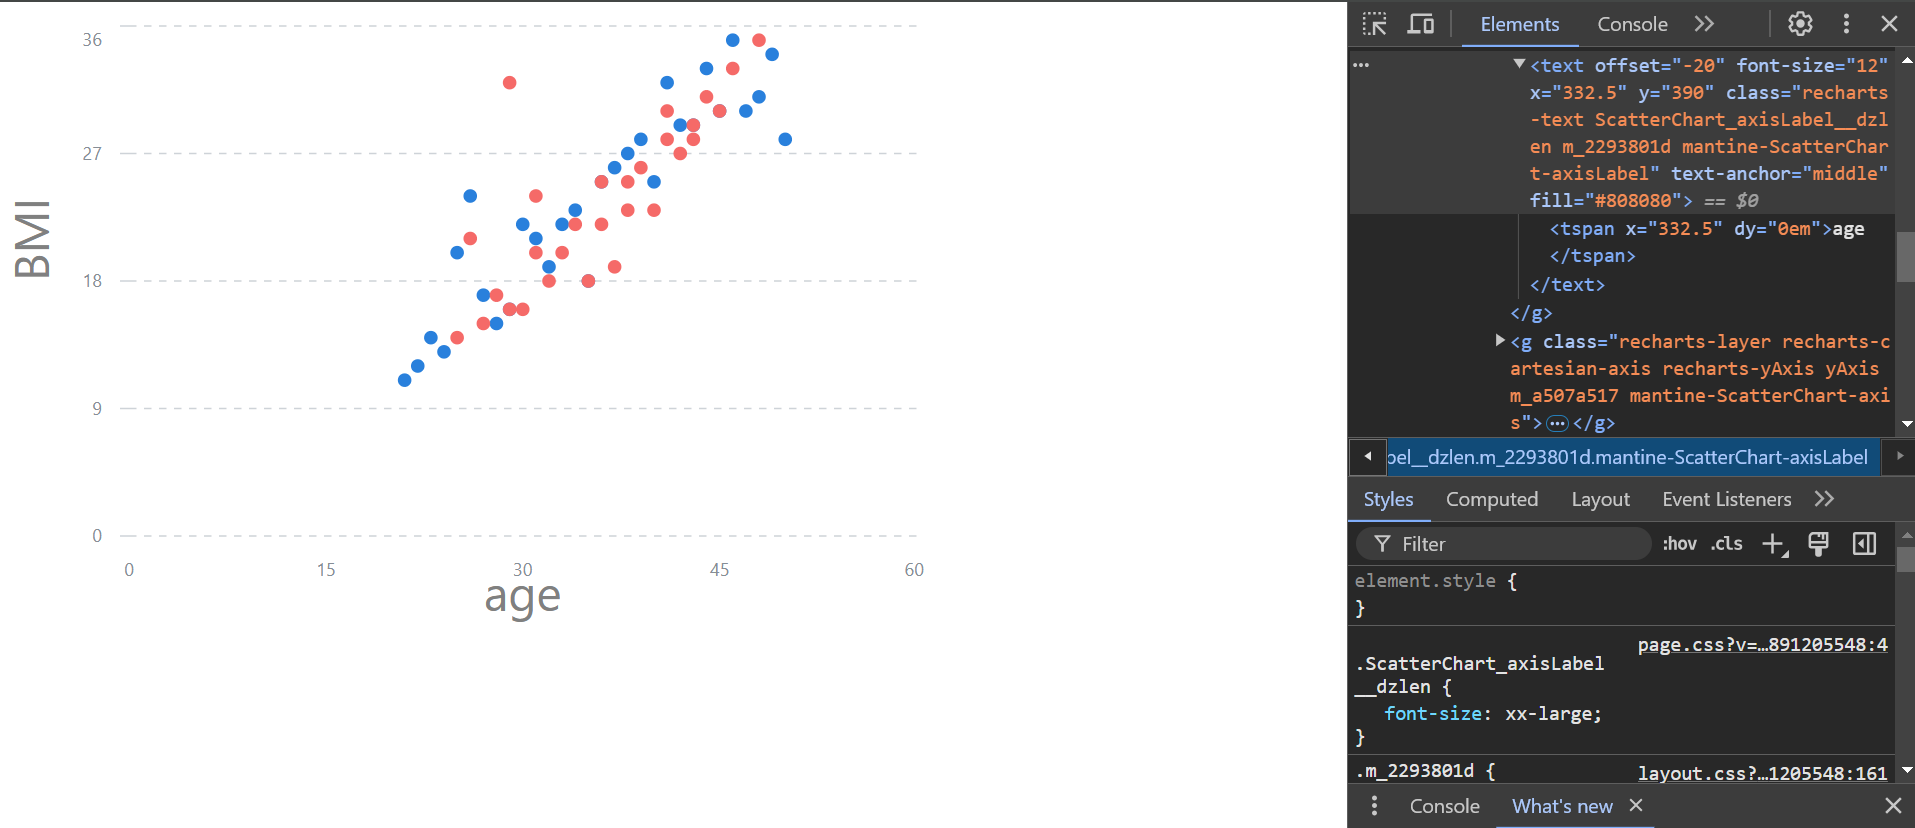
X軸に age、Y軸に BMI と表示されます。
X軸・Y軸のラベルスタイス
Styles API を使ったカスタマイズもできます。
以下では、Selector の axisLabel でフォントサイズを xx-large にしています。
.axisLabel {
  font-size: xx-large;
}
import { ScatterChart } from "@mantine/charts";
import { data } from "./data";
import classes from "./css_modules/ScatterChart.module.css";

export default function Demo() {
  return (
    <ScatterChart
      h={400}
      w={600}
      classNames={{
        axisLabel: classes.axisLabel,
      }}
      data={data}
      dataKey={{ x: "age", y: "BMI" }}
      xAxisLabel="age"
      yAxisLabel="BMI"
    />
  );
}
xAxisProps / yAxisProps props を利用したカスタマイズ
次は xAxisProps / yAxisProps props を利用したカスタマイズ方法を記載します。
xAxisProps / yAxisProps を通して Recharts の XAxis、YAxis コンポーネントに渡す props を指定できます。
X軸・Y軸のラベル表示
XAxis 、YAxis の props にも label は存在します。そのため、以下の実装でもX軸・Y軸にラベルを表示できます。
import { ScatterChart } from "@mantine/charts";
import { data } from "./data";

export default function Demo() {
  return (
    <ScatterChart
      h={400}
      w={600}
      data={data}
      dataKey={{ x: "age", y: "BMI" }}
      xAxisProps={{ label: "age" }}
      yAxisProps={{ label: "BMI" }}
    />
  );
}
ただ、X軸・Y軸ともにラベルが目盛りと表示が被ってしまいます。
また、Y軸のラベルは横向きに表示されます。
X軸・Y軸のラベルスタイル
ラベルのスタイルの調整は、XAxis、YAxis props の label に渡す props で調整可能です。
詳しい内容は、Label コンポーネントのドキュメントに記載があります。
label に position や angle を指定することで、ラベルと目盛りの被りやY軸ラベルが横向きになっていた問題を解消できます。
import { ScatterChart } from "@mantine/charts";
import { data } from "./data";

export default function Demo() {
  return (
    <ScatterChart
      h={400}
      w={600}
      data={data}
      dataKey={{ x: "age", y: "BMI" }}
      xAxisProps={{
        label: {
          value: "age",
          position: "bottom",
        },
      }}
      yAxisProps={{
        label: {
          value: "BMI",
          angle: -90,
          position: "insideLeft",
        },
      }}
    />
  );
}
xAxisLabel / yAxisLabel と同じように Styles API を利用したカスタマイズも可能です。Selector の axis や axisLabel を利用できます。


