はじめに
nim関係で2度目の投稿です。
今回はファイルを読み込んで得られた数値をgnuplotとgnuplotインターフェース(https://github.com/dvolk/gnuplot.nim)を用いてグラフにしていきたいと思います。
nimでgnuplotを使うに至るまではこちらを参考にしてください(なるだろうか?)
https://qiita.com/YagiEL39/items/be050672b2a49757d6de
	鉄筋4本梁				鉄筋2本梁
	荷重(kN)	たわみ(mm)			荷重(kN)	たわみ(mm)
1	0	0		1	0	0
2	0.283	0.137		2	0.129	0.034
3	0.512	0.219		3	0.422	0.084
4	1.01	0.357		4	0.408	0.158
5	1.561	0.484		5	0.616	0.204
6	1.994	0.57		6	0.877	0.253
7	2.574	0.699		7	1.171	0.299
8	3.09	0.843		8	1.425	0.393
9	3.598	0.988		9	1.582	0.446
10	3.673	1.018		10	1.912	0.594
11	3.831	1.091		11	1.858	0.65
12	3.934	1.215		12	1.844	0.834
13	3.809	1.308		13	1.862	1.025
14	3.974	1.41		14	1.88	1.306
15	4.028	1.515		15	1.872	1.516
16	4.149	2.017		16	1.908	2.001
17	4.217	3.018		17	1.908	2.525
18	4.21	4.012		18	1.894	3.027
19	4.221	5.011		19	1.854	3.496
20	3.963	6.026		20	1.726	4.054
21	3.501	6.62
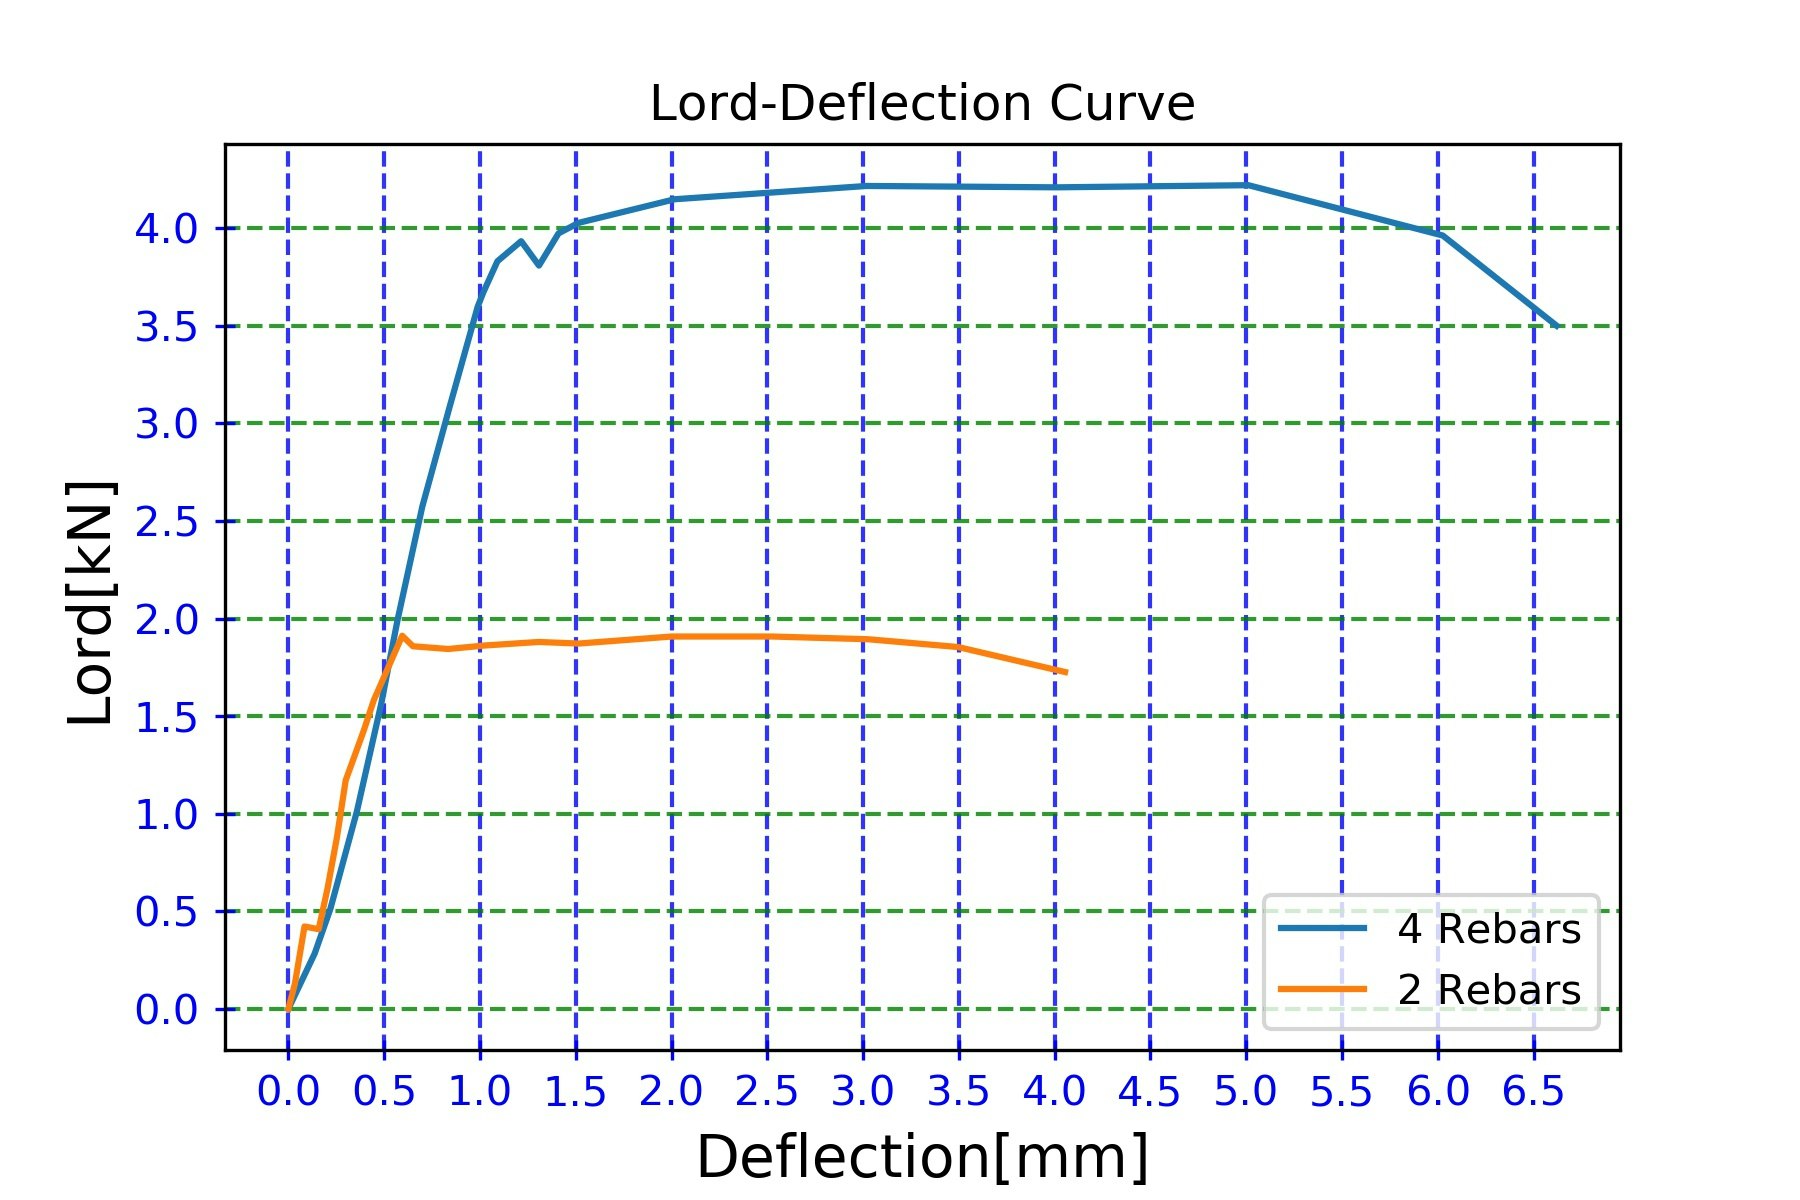
大学で鉄筋コンクリート試験体破壊(小さいやつだけど)実験をやったときの荷重とたわみのデータです。
今回はこれを使おうかなと思います。pythonをいじっていた時はmatplotlibを利用してこんな感じでやってました。
import matplotlib.pyplot as plt

file=open("LD_curve.txt",'r',encoding="utf-8")
data=file.readlines()
file.close()
kajyu1,tawami1,kajyu2,tawami2=[],[],[],[]
for j,i in enumerate(data):
    if 1<j and j<22:
        i=i.strip("\n").split("\t")
        kajyu1.append(float(i[1]))
        tawami1.append(float(i[2]))
        kajyu2.append(float(i[5]))
        tawami2.append(float(i[6]))
    elif j==22:
        i=i.strip("\n").split("\t")
        kajyu1.append(float(i[1]))
        tawami1.append(float(i[2]))
fig=plt.figure()
ax=fig.add_subplot(1,1,1)
ax.set_title("Lord-Deflection Curve")
ax.set_xlabel("Deflection[mm]",size=14,weight="light")
ax.set_ylabel("Lord[kN]",size=14,weight="light")
ax.set_xticks([i/2 for i in range(14)])
ax.set_yticks([i/2 for i in range(10)])
ax.tick_params(direction = "inout", length = 5, colors = "blue")
ax.grid(which = "major", axis = "x", color = "blue", alpha = 0.8,
        linestyle = "--", linewidth = 1)
ax.grid(which = "major", axis = "y", color = "green", alpha = 0.8,
        linestyle = "--", linewidth = 1)
ax.plot(tawami1,kajyu1,label="4 Rebars")
ax.plot(tawami2,kajyu2,label="2 Rebars")
ax.legend(loc="best")
plt.savefig("result.jpg",dpi=300)
plt.show()
pythonだとこんな感じになりますね。
これを今回はnimでやってみようかなと思います。
目次
1. ファイル読み書きの練習
2. 最低限のグラフ描画まで
3. gnuplotの練習
1.ファイル読み書きの練習
まずtxtファイルの作成&書き込みをやってみましょう。
block:
    var f:File=open("test.txt",Filemode.fmWrite)
    defer:
        close(f)
        echo "closed"
    f.writeLine "nimnimしてきたな。"
    f.writeLine "先生に訊いてみよう"
    f.writeLine "先生、nimしてもいいですか?"
    f.writeLine "ダメです。"
    f.writeLine "あああああああああああああ"
で、その結果。
nimnimしてきたな。
先生に訊いてみよう
先生、nimしてもいいですか?
ダメです。
あああああああああああああ
次に読み込んでみましょう
import os
block:
    var f:File=open("test.txt",Filemode.fmRead)
    defer:
        close(f)
        echo "closed"
    for i in 1..4:
        echo f.readLine()
出力はこんな感じになります。
"nimnimしてきたな。
先生に訊いてみよう
先生、nimしてもいいですか?
ダメです。
あああああああああああああ
closed"
ってなります。
じゃあこれを利用してLD_curve.txtの読み込み→そのまま表示までやってみましょう。
block:
    var f:File=open("LD_curve.txt",Filemode.fmRead)
    defer:
        f.close()
        echo "closed"
    echo f.readAll()
でokですね(^ω^)b
そうそう、これは余談ですが、nimはgoみたいにdeferを利用することができます。block内でbreakとかしても最後に必ずdefer内が処理されます。
途中で抜けようが抜けまいが必ずやってほしい処理を記述できます。
deferについては私の理解がまだこの程度なので後で詳しく書いてみたいですね。
2.最低限のグラフ描画まで
"必要な数値を取り出してseqに入れる→プロットする"の手順で最低限のグラフ描画を行います。
import strutils,gnuplot
var
    x1,y1:seq[float64]= @[]#鉄筋4本用
    x2,y2:seq[float64]= @[]#鉄筋2本用
block:
    var f:File=open("LD_curve.txt",Filemode.fmRead)
    defer:
        f.close()
        echo "closed"
    while f.endOfFile!=true:#Fileに残りの行がなくなるとtrueになるので注意
        var
            temp1:seq[string]= @[]
        temp1=f.readLine().split("\t")
        try:
            y1.add(temp1[1].parseFloat)
            x1.add(temp1[2].parseFloat)
            try:
                y2.add(temp1[5].parseFloat)
                x2.add(temp1[6].parseFloat)
            except:
                echo "failed"#pythonのpass的なのを探してます。
        except:
            echo "failed"

plot x1,y1,"4Rebars"#最後のstringは凡例
plot x2,y2,"2Rebars"

discard readChar stdin
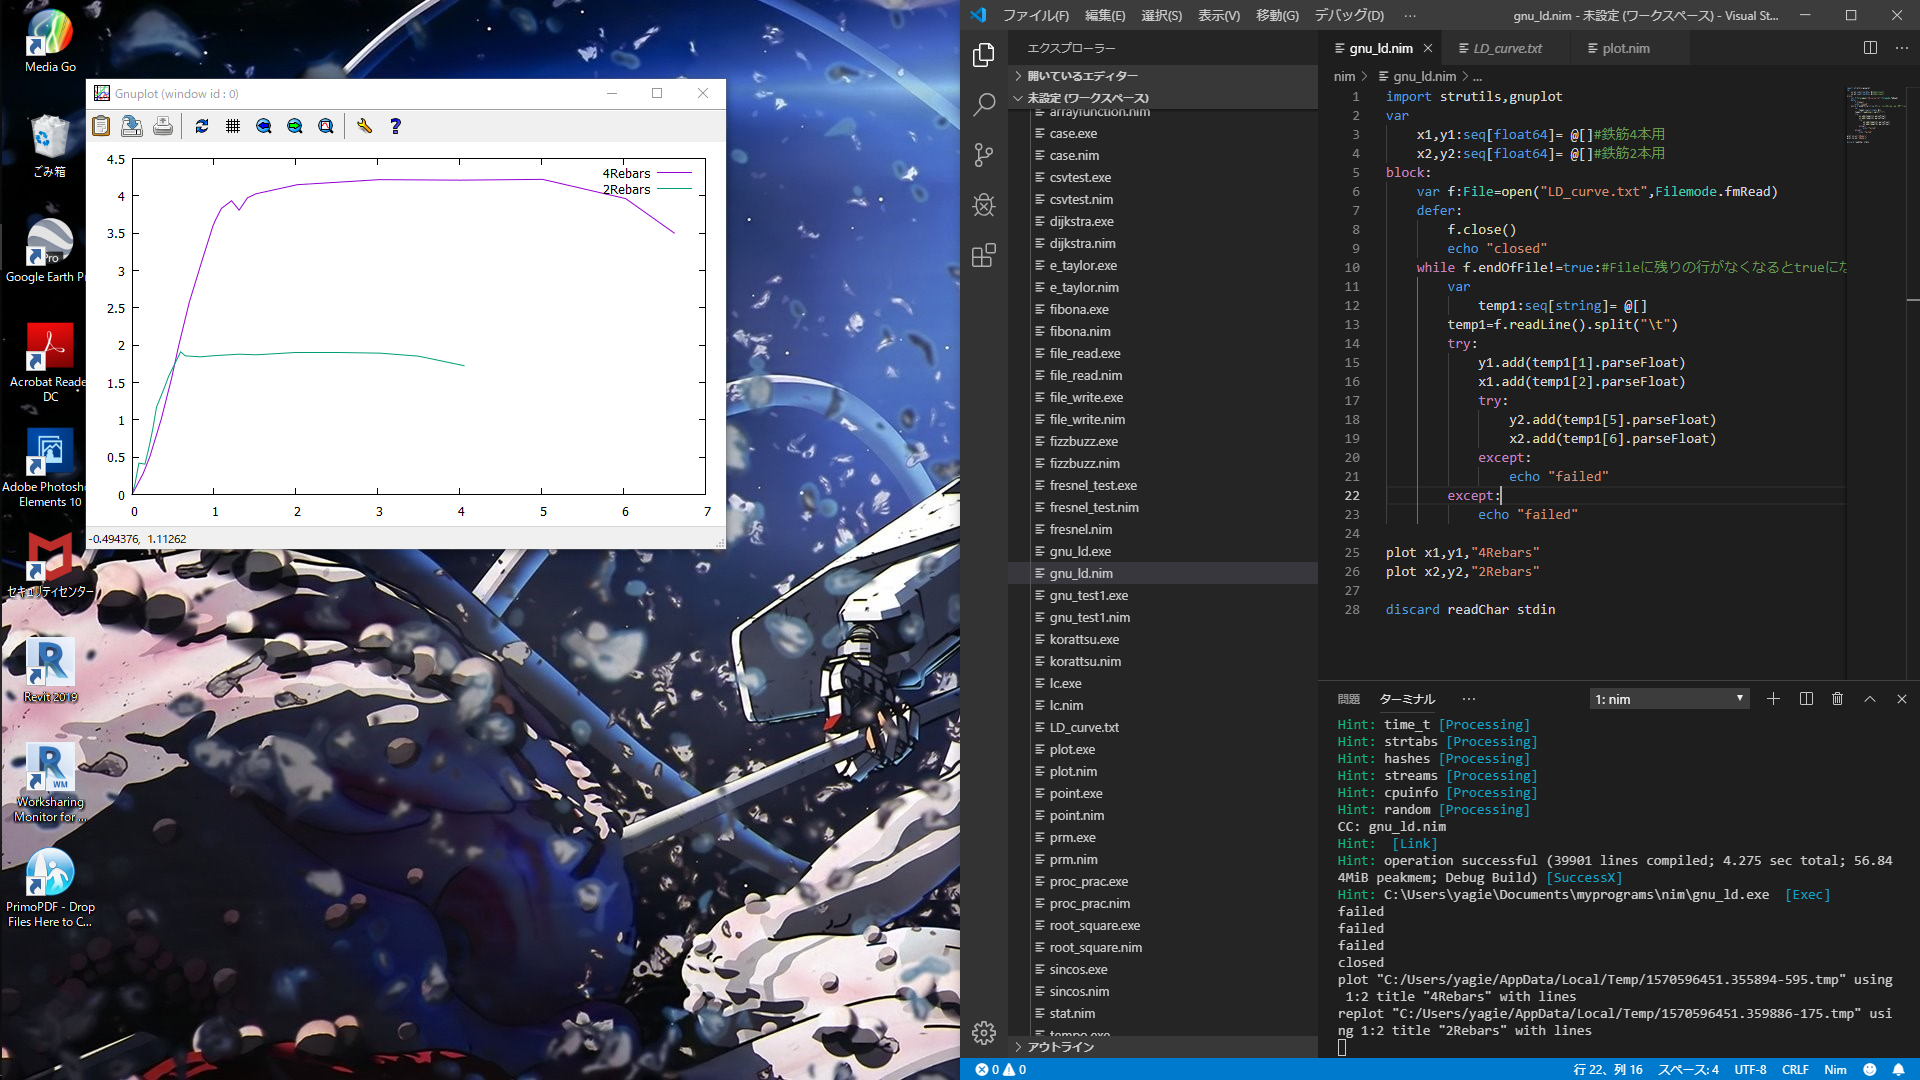
で、こいつをターミナルで"nim c -r gnu_ld.nim"してやると...
gnuplotの方がこんな感じになります。
3.gnuplotの練習
gnuplotは触り始めたばっかりなので私はド素人ですが、グラフを描くにあたっていくらか調整していきたいと思います。
gnuplotインターフェースにはcmdプロシージャが用意されていて、ちょっとスマートではないですが、cmd("gnuplotコマンド")でgnuplotコマンドを利用することができます。というかgnuplotインターフェースにはplotとそのスタイル(線とか点とか)をいじるためのプロシージャしか用意されていないので、グラフの詳細設定にはcmdを使うしかないようです。
3-1.グラフタイトル
cmd "set title 'グラフタイトル'"
でグラフタイトルを付けられます。
3-2.各軸ラベル
cmd "set xlabel 'x軸ラベル'"
cmd "set ylabel 'y軸ラベル'"
3-3.格子線
cmd "set grid"
3-4.最終的なグラフ
さてさて、色々いじくった後のグラフを表示してみましょう。
import strutils,gnuplot
var
    x1,y1:seq[float64]= @[]#鉄筋4本用
    x2,y2:seq[float64]= @[]#鉄筋2本用
block:
    var f:File=open("LD_curve.txt",Filemode.fmRead)
    defer:
        f.close()
        echo "closed"
    while f.endOfFile!=true:#Fileに残りの行がなくなるとtrueになるので注意
        var
            temp1:seq[string]= @[]
        temp1=f.readLine().split("\t")
        try:
            y1.add(temp1[1].parseFloat)
            x1.add(temp1[2].parseFloat)
            try:
                y2.add(temp1[5].parseFloat)
                x2.add(temp1[6].parseFloat)
            except:
                echo "failed"
        except:
            echo "failed"

cmd "set title 'Lord-Deflection Curve'"#グラフタイトル
cmd "set grid"#格子線
cmd "set xlabel 'Deflection[mm]'" # 各軸ラベル
cmd "set ylabel 'Lord[kN]'"
plot x1,y1,"4Rebars"
plot x2,y2,"2Rebars"

discard readChar stdin
で、結果のグラフがこちら!!
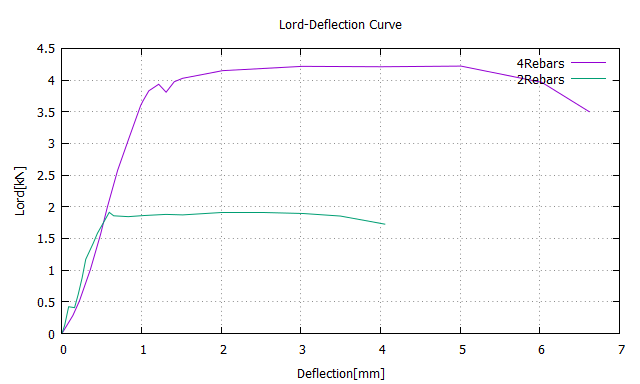
ちゃんと出てきましたねー
以上、gnuplotファイル読み込み→グラフ描画してみたでしたー