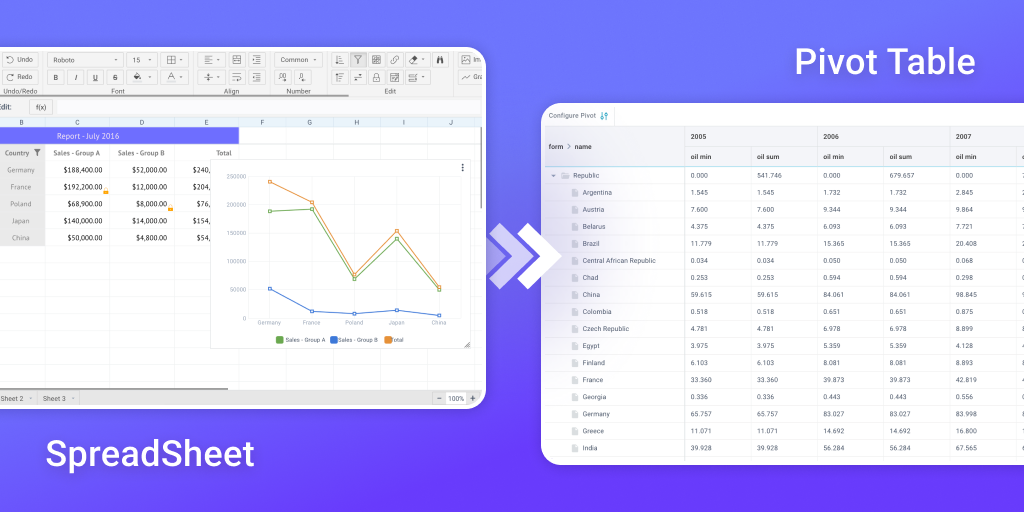
Integrating Webix SpreadSheet with Pivot: A Practical Developer’s Guide
In this guide, we’ll walk through a real-world implementation of two powerful Webix components: SpreadSheet and Pivot. You’ll learn how to combine these widgets to transform editable tabular data into analytical reports — ideal for business dashboards, KPI monitoring, and beyond.
Why Use SpreadSheet and Pivot Together?
Combining SpreadSheet with Pivot opens up rich, interactive workflows that blend data manipulation with real-time analytics. Common use cases include:
- Editing raw datasets (like sales reports or inventory lists) and summarizing them for trend analysis
- Aggregating live metrics for dashboards or industrial monitoring
- Modeling KPIs and financials — preprocessing in a spreadsheet, summarizing in a pivot
- Building educational or assessment systems where users input and analyze data in the same UI
Widget Overview: SpreadSheet & Pivot
SpreadSheet
Webix SpreadSheet provides Excel-like functionality in the browser. It supports sorting, filtering, cell editing, formula evaluation, and data manipulation — all within a familiar tabular interface.
Pivot
Pivot is designed for aggregating and visualizing large volumes of structured data. It transforms rows into high-level summaries and supports charts and breakdowns via an intuitive UI.
In this tutorial, we’ll:
- Load and edit data in
SpreadSheet - Select a data range
- Generate a dynamic Pivot table from the selected subset
Step 1: Initialize SpreadSheet with JSON Data
We’ll begin by rendering the SpreadSheet and populating it with a dataset via the url property. We’ll also add a custom button that will later be wired to trigger Pivot generation.
const spreadsheet = webix.ui({
    view:"spreadsheet",
    url: "https://api.npoint.io/8810a0b031cff6cc9c0a",
    subbar:{
        view:"button",
        label:"SUMMARY TABLE",
        css:"webix_ssheet_toolbar",
        click: () => {},
    }
});
Step 2: Add Click Logic for Pivot Generation
Fetch and Validate Selection
When the "SUMMARY TABLE" button is clicked, we capture the selected cell range and validate it. Pivot tables require at least two rows: one for headers and at least one for data.
const pivotData = [];
const selected = spreadsheet.$$("cells").getSelectArea();

if(selected){
    if(selected.end.row == selected.start.row)
        return pivotGenerationError("2 or more rows of data are required.");
} else {
    return pivotGenerationError("No cells selected.");
}

function pivotGenerationError(text){
    webix.alert({
        title: "Unable to generate pivot table",
        text: text,
        type:"alert-warning"
    });
}
Serialize the Spreadsheet (Skip Formulas)
We export the selected data from SpreadSheet, skipping formulas to ensure raw values are extracted:
const serialized = spreadsheet.serialize({math:false});
Step 3: Build Field Metadata and Structure
We define fields and structure—the metadata and configuration that drive the Pivot widget.
const fields = [];
const structure = { rows: [], values: [] };
Now, iterate over the selected rows and columns. The first row becomes the header. Remaining rows are turned into data objects for the Pivot.
for(let r = selected.start.row; r <= selected.end.row; r++){
    const row = {};
    for(let c = selected.start.column; c <= selected.end.column; c++){
        const value = spreadsheet.getCellValue(r, c, false);
        if(r == selected.start.row){
            if(value)
                addField(serialized, fields, structure, r, c, value);
            else
                return pivotGenerationError("An empty cell cannot be used as a field name.");
        }
        else
            row[fields[c-selected.start.column].id] = value;
    }
    if(r != selected.start.row)
        pivotData.push(row);
}
Define addField Utility
This function analyzes the next row to infer the type (text/number/date), assigns a unique ID, and updates both field definitions and the Pivot structure.
function addField(serialized, fields, structure, row, col, value){
    const nextRowItem = serialized.data.find(item => item[0] == row+1 && item[1] == col);
    const type = nextRowItem && nextRowItem[4] != "string" ? nextRowItem[4] : "text";
    const id = "field"+webix.uid();
    fields.push({
        id, type, value,
        predicate: type == "date" ? "date" : null,
        prepare: type == "date" ? getJsDateFromExcel : null
    });
    if(type == "number")
        structure.values.push({name: id, operation: "sum"});
    else
        structure.rows.push(id);
}
Convert Excel-style serial dates to JS Date objects:
function getJsDateFromExcel(excelDate) {
    const date = new Date(Math.round((excelDate - 25569) * 86400 * 1000));
    return new Date(date.getTime() + date.getTimezoneOffset() * 60000);
}
Step 4: Render the Pivot Table
Now that we have structured data and metadata, we can load the Pivot:
loadNewPivotData(pivotData, structure, fields);
pivotWindow.show();
Function to inject data and structure:
function loadNewPivotData(data, structure, fields){
    const pivot = pivotWindow.getBody();
    pivot.clearAll();
    const config = pivot.$app.config;
    config.fields = fields;
    config.data = data;
    return pivot.getService("local").getData(true).then(() => {
        pivot.setStructure(structure);
    });
}
Step 5: Backend Override for Pivot
We provide a custom backend for Pivot to use the generated data:
class MyBackend extends pivot.services.Backend {
    data() {
        return webix.promise.resolve(this.app.config.data || []);
    }
}
Step 6: Initialize Pivot in a Fullscreen Window
Create a modal Pivot viewer:
const pivotWindow = webix.ui({
    view:"window",
    head:"SUMMARY TABLE",
    close:true,
    fullscreen:true,
    body:{
        view:"pivot",
        predicates: {
            date: webix.Date.dateToStr(webix.i18n.dateFormat),
        },
        override: new Map([[pivot.services.Backend, MyBackend]]),
    }
});
Conclusion
By integrating Webix SpreadSheet and Pivot, we’ve built a highly interactive workflow that allows users to edit data and generate summary tables on the fly. This solution supports scalable analytics, improves UX, and keeps your app architecture clean by leveraging Webix's modular approach.
If you're building data-centric interfaces with JavaScript, this pattern gives you the best of both worlds—spreadsheet flexibility and pivot-driven insight. Give it a try and see how easily you can scale it for your business logic.