Pythonの統計分析ライブラリであるStatsmodelsには,通常の関数型呼び出しに対応するAPIと,R-styleのモデル式を用いる数式対応API(formula API)の2種類が実装されている.Formula APIは複雑な回帰モデルを使う際に有用であるが,モデル式について理解不足があったので,少し整理してみた.
(記事作成時の環境は,python 2.7.8, patsy 0.3.0, statsmodels 0.61 となります.)
Patsyって何だ
Patsyのドキュメント冒頭には,"It's only a model." と気の利いた一文があるが,統計モデルを表現する数式の扱いをサポートするPythonモジュールである.このPatsyを単独で使用する機会はほとんどなく,StatsmodelsやPyMC3の下請けの形で用いられる.(ドキュメントにはPatsyモジュールのインストール方法が載っていましたが,ほとんどのケースではStatsmodels他のモジュールをインストールする際に一緒に導入しているかと思います.)
使用例 (Statsmodelsドキュメントから引用)
# DataFrame
   Lottery  Literacy  Wealth Region
0       41        37      73      E
1       38        51      22      N
2       66        13      61      C
3       80        46      76      E
4       79        69      83      E

import statsmodels.api as sm
import statsmodels.formula.api as smf

mod = smf.ols(formula='Lottery ~ Literacy + Wealth + Region', data=df)
res = mod.fit()
この**'Lottery ~ Literacy + Wealth + Region'**の部分がモデル式で,Patsyにより解釈,展開されてStatsmodelsの処理に使われる.容易に想像できる通り,上のモデル式は「被説明変数 Lottery は,独立変数 Literacy,Wealth,Region により説明される」ことを表しており,上のリストは重回帰分析(Multiple Regression)を行っている.
モデル式の文法
Patsyのドキュメントには,さまざまなモデル式について説明されているが,少し分かりにくいな書き方になっている.もともとR-styleの共用を考えての導入なので,Rの解説本が参考になる.以下,代表的なモデル式について示す.
モデル式の内容
| モデル式 | 式の内容 |
|---|---|
| y ~ x | 回帰モデル,yはxにより説明される |
| y ~ x1 + x2 | yは,独立変数 x1 と x2 により説明される(重回帰モデル) |
| y ~ 1 + x1 + x2 | y は,(切片 / intercept と)x1,x2 で説明される |
| y ~ x1:x2 | yは,x1 と x2 の交互作用項 (x1 * x2) で説明される |
| y ~ x1 * x2 | yは,x1とx2の各変数,及びその組み合わせで構成される交互作用項により説明される (x1 + x2 + x1* x2 と同じ |
| y ~ I(x + 5) | I()の中は,数式を示す.Patsy解釈をエスケープする |
自分の用意したモデル式によって,データがどのように展開されるかを確認したいケースも出てくるが,Patsyモジュールの dmatrices(), dmatrix() は,与えたデータを展開する機能をサポートしている.
dmatrices() は,被説明変数(y)を含めて式を展開する.(第2引数は,テストデータ.)
>>> from patsy import dmatrices, dmatrix
>>> dmatrices("y ~ x1", data)
>>>
(DesignMatrix with shape (8L, 1L)
          y
    1.49408
   -0.20516
    0.31307
   -0.85410
   -2.55299
    0.65362
    0.86444
   -0.74217
   Terms:
     'y' (column 0),
 DesignMatrix with shape (8L, 2L)
   Intercept        x1
           1   1.76405
           1   0.40016
           1   0.97874
           1   2.24089
           1   1.86756
           1  -0.97728
           1   0.95009
           1  -0.15136
   Terms:
     'Intercept' (column 0)
     'x1' (column 1))
**dmatrix()**は,("y~"を含めない式で)モデル式を展開する.
>>> dmatrix("x1+x2+x1:x2", data)
>>>
DesignMatrix with shape (8L, 4L)
  Intercept        x1        x2     x1:x2
          1   1.76405  -0.10322  -0.18208
          1   0.40016   0.41060   0.16430
          1   0.97874   0.14404   0.14098
          1   2.24089   1.45427   3.25887
          1   1.86756   0.76104   1.42128
          1  -0.97728   0.12168  -0.11891
          1   0.95009   0.44386   0.42171
          1  -0.15136   0.33367  -0.05050
  Terms:
    'Intercept' (column 0)
    'x1' (column 1)
    'x2' (column 2)
    'x1:x2' (column 3)
上記のようにカラムごとに分けられたデータにより,"x1:x2" が交互作用項(x1 ∗ x2,x1 と x2の積)となっていることが確認できる.ここで,モデル式,"I()"の機能について確認しておく.
>>> dmatrix("x1 * x2", data)
>>>
DesignMatrix with shape (8L, 4L)
  Intercept        x1        x2     x1:x2
          1   1.76405  -0.10322  -0.18208
          1   0.40016   0.41060   0.16430
          1   0.97874   0.14404   0.14098
          1   2.24089   1.45427   3.25887
          1   1.86756   0.76104   1.42128
          1  -0.97728   0.12168  -0.11891
          1   0.95009   0.44386   0.42171
          1  -0.15136   0.33367  -0.05050
(後略)
>>> dmatrix("I(x1 * x2)", data)
>>>
DesignMatrix with shape (8L, 2L)
  Intercept  I(x1 * x2)
          1    -0.18208
          1     0.16430
          1     0.14098
          1     3.25887
          1     1.42128
          1    -0.11891
          1     0.42171
          1    -0.05050
(後略)
前半のエスケープ関数 "I()" を使わないケースでは,アスタリスク "∗" をPatsyの「与えた独立変数とその交互作用項に展開する」といった解釈が行われ,"I()"を使うと「乗算演算子」として解釈されている状況が分かる.
興味がわいたので,独立変数3つの"∗" (I() 無し)を調べてみた.
>>> dmatrix("x1 * x2 * x3", mydata)
>>>
DesignMatrix with shape (8L, 8L)
  Columns:
    ['Intercept', 'x1', 'x2', 'x1:x2', 'x3', 'x1:x3', 'x2:x3', 'x1:x2:x3']
  Terms:
    'Intercept' (column 0)
    'x1' (column 1)
    'x2' (column 2)
    'x1:x2' (column 3)
    'x3' (column 4)
    'x1:x3' (column 5)
    'x2:x3' (column 6)
    'x1:x2:x3' (column 7)
  (to view full data, use np.asarray(this_obj))
数値の出力は省略されてしまったが,"x1 * x2 * x3"が(Interceptを含めて)8つの項に展開されることが分かった.('Intercept', 'x1', 'x2', 'x1:x2', 'x3', 'x1:x3', 'x2:x3', 'x1:x2:x3')
因みに累乗(べき乗)も"I()"でエスケープする必要がある.
# I() 無し.
>>> dmatrix("x1 ** 2", data)
>>>
DesignMatrix with shape (8L, 2L)
  Intercept        x1
          1   1.76405
          1   0.40016
          1   0.97874
          1   2.24089
          1   1.86756
          1  -0.97728
          1   0.95009
          1  -0.15136
  Terms:
    'Intercept' (column 0)
    'x1' (column 1)
# x1 のまま.

# I() を使用.
>>> dmatrix("I(x1 **2)", data)
>>>
DesignMatrix with shape (8L, 2L)
  Intercept  I(x1 ** 2)
          1     3.11188
          1     0.16013
          1     0.95793
          1     5.02160
          1     3.48777
          1     0.95507
          1     0.90267
          1     0.02291
  Terms:
    'Intercept' (column 0)
    'I(x1 ** 2)' (column 1)
I()を使わない"x1 ∗∗2" では,x1 はそのままの形が出力され期待する2乗のデータとなっていない.(Patsyモデル式では(a + b + c)**2 のような使い方で,独立変数の組み合わせ項(交互作用項を含む式)を導出するのに使うそうです.)
多項式回帰モデルを使う
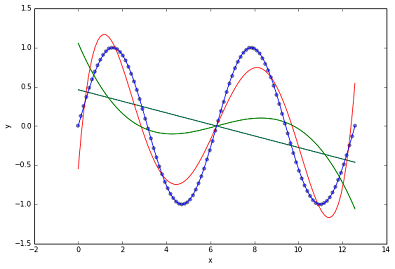
ここまで調べたことを踏まえて,多項式回帰モデルを使った回帰分析を行った.対象データは,sine curveのデータ,Fittingに使うモデルは,1次から5次までの(交互作用項を含まない)5種類の多項式モデルである.一般式で表すと次のようになる.
y = a_0 + a_1 x + a_2 x^2 + a_3 x^3 + \cdots + a_n x^n \ \ (n=1, 2, 3, 4, 5)
上図の通り,フィッティング対象のデータは,2周期分のSineデータである.1次から4次の多項式(緑色)ではあまりよくフィッティングできておらず,5次(赤色)でようやく近づいたという感じである.決定係数(R-squared)は,次の通りになった.
R-squared numbers:
poly_1 : 0.147086633025  # 緑色の線
poly_2 : 0.147086633025  # 緑色の線
poly_3 : 0.261777522262  # 緑色の線
poly_4 : 0.261777522262  # 緑色の線
poly_5 : 0.897860130176  # 赤色の線
sine_1 : 1.0    # 青色の線
sin関数を使ったフィッティングは,周波数も一致していたので,R-squred = 1.0 で完全に一致している.また,1次(poly_1)と2次(poly_w),3次(poly_3) と4次(poly_4)の結果が同一となったのは,"sin"のテーラー展開を見れば,その理由を理解できる.
\sin x = x - \frac{x^3}{3 !} + \frac{x^5}{5 !} - \frac{x^7}{7 !} + \frac{x^9}{9 !} + \cdots
上記の通り,べき乗の値が奇数の項のみでsinが構成されているので,偶数べき乗項を追加した2次項までの近似(poly_2)や4次項までの近似(poly_4)では,それぞれpoly_1やpoly_3に対してフィッティング精度が上がらないことになる.(但し,これはsinの位相が (x,y)=(0,0) 始まりのsinデータ列に限っていえることであり,位相が多少でもずれれば,偶数べき乗項の影響が発生する状況となるはずである.)
Patsyの機能は,次のPythonモジュールで使われているとのことである.(Patsyドキュメントより引用)
- Statsmodels
- PyMC3 (tutorial)
- HDDM
- rERPy
- UrbanSim
これから使用する機会があるのは,StatsmodelsとPyMC3の2つと予想される.PyMC3では,まだモデル式についてドキュメント化されておらず,どの程度サポートされているか不明であるが,後日,試してみたい.
参考文献
- Patsyドキュメント
https://patsy.readthedocs.org/en/latest/index.html - Statsmodelsドキュメント
http://statsmodels.sourceforge.net/stable/ - 実践R統計分析(オーム社)
http://www.amazon.co.jp/%E5%AE%9F%E8%B7%B5-R-%E7%B5%B1%E8%A8%88%E5%88%86%E6%9E%90-%E5%A4%96%E5%B1%B1-%E4%BF%A1%E5%A4%AB/dp/4274217515 - [Qiita] Pythonで実装 PRML 第1章 多項式曲線フィッティング
http://qiita.com/tkazusa/items/69692d92726508c09cb3
