はじめに
星空を地図のように表示するため、Maplibre GL JSを使って星図を作成しました。
この記事では、ESAが提供するヒッパルコス星表・カタログデータを使って、ブラウザ上で動作する星図ビューアを作成する方法を紹介します。
なお、本コード作成には、Github Copilot(Caude Sonnet4.5)を使用しております。
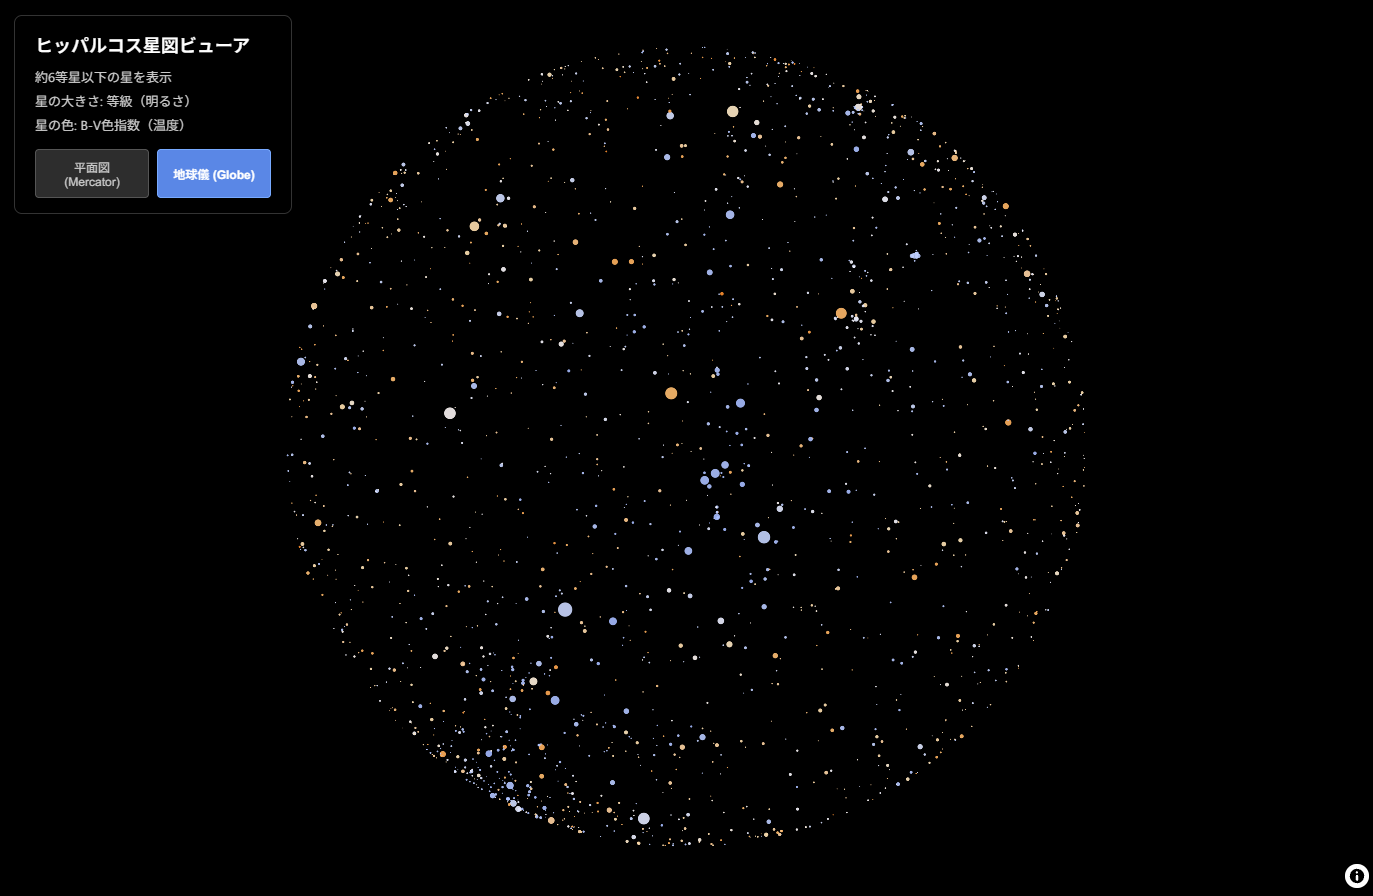
完成イメージ
- 約6等星までの星(肉眼で見える範囲)を表示
- 星の明るさに応じてサイズが変化
- 星の色温度(B-V色指数)に基づいて色分け
- MercatorとGlobeプロジェクションの切り替え可能
- 星をクリックすると詳細情報を表示
技術スタック
- MapLibre GL JS v5.13.0: オープンソースの地図描画ライブラリ
- Python 3.7+: データ変換用
- pandas: CSVデータ処理
- ヒッパルコス星表: 約118,000個の星のデータ
完成イメージ

プロジェクト構成
maplibre_star_map/
├── hip.csv                 # ヒッパルコス星表データ
├── convert_stars.py        # データ変換スクリプト
├── stars.geojson          # 変換後のGeoJSONデータ
├── index.html             # メインHTMLファイル
├── style.css              # スタイルシート
└── app.js                 # MapLibre GL JS設定
Step 1: データ変換スクリプトの作成
ヒッパルコス星表を下記よりダウンロードし、CSVデータをMapLibre GL JSで扱えるGeoJSON形式に変換します。
ポイント1: 座標変換
天球座標(赤経・赤緯)を地図座標(経度・緯度)に変換します。重要なのは赤経を反転させることです。
これは、星図は「見上げる」視点、地図は「見下ろす」視点という違いがあるためです。
def convert_coordinates(row):
    # 赤経を度数法に変換(24時間系 → 360度系)
    ra_deg = (float(row['RA_h']) + float(row['RA_m'])/60 +
              float(row['RA_s'])/3600) * 15

    # 赤緯を度数法に変換
    dec_deg = float(row['Dec_sign']) * (float(row['Dec_d']) +
              float(row['Dec_m'])/60 + float(row['Dec_s'])/3600)

    # 地図投影用に経度を反転(重要!)
    lon = -ra_deg
    if lon < -180:
        lon = lon + 360

    lat = dec_deg

    return lon, lat
ポイント2: データフィルタリング
全118,000個の星を表示するとパフォーマンスが低下するため、実視等級6.0以下(肉眼で見える範囲)に絞ります。
# 等級6.0以下でフィルタリング
df = df[df['Vmag'] <= 6.0].copy()
ポイント3: GeoJSON形式での出力
MapLibreが読み込めるGeoJSON FeatureCollectionを生成します。
geojson = {
    "type": "FeatureCollection",
    "features": [
        {
            "type": "Feature",
            "geometry": {
                "type": "Point",
                "coordinates": [lon, lat]
            },
            "properties": {
                "id": int(row['HIP_ID']),
                "mag": float(row['Vmag']),
                "bv": bv  # B-V色指数
            }
        }
        # ... 各星のデータ
    ]
}
完全な convert_stars.py は記事末尾に掲載します。
Step 2: HTMLの準備
<!DOCTYPE html>
<html lang="ja">
<head>
    <meta charset="UTF-8">
    <meta name="viewport" content="width=device-width, initial-scale=1.0">
    <title>MapLibre GL JS 星図ビューア</title>
    <link rel="stylesheet" href="https://unpkg.com/maplibre-gl@5.13.0/dist/maplibre-gl.css">
    <link rel="stylesheet" href="style.css">
</head>
<body>
    <div id="map"></div>
    <div id="info">
        <h2>ヒッパルコス星図ビューア</h2>
        <p>約6等星以下の星を表示</p>
        <p>星の大きさ: 等級(明るさ)</p>
        <p>星の色: B-V色指数(温度)</p>
        <div id="projection-toggle">
            <button id="mercator-btn" class="active">平面図 (Mercator)</button>
            <button id="globe-btn">地球儀 (Globe)</button>
        </div>
    </div>

    <script src="https://unpkg.com/maplibre-gl@5.13.0/dist/maplibre-gl.js"></script>
    <script src="app.js"></script>
</body>
</html>
Step 3: MapLibreの初期化とスタイリング
Data-Driven Stylingを使って星の見た目を調整します。
MapLibreマップの初期化
const map = new maplibregl.Map({
    container: 'map',
    style: {
        version: 8,
        sources: {},
        layers: [{
            id: 'background',
            type: 'background',
            paint: {
                'background-color': '#000000'  // 真っ黒な背景
            }
        }],
        projection: {
            type: 'mercator'
        }
    },
    center: [0, 0],
    zoom: 1.5,
    maxZoom: 10,
    minZoom: 0
});
星の大きさ: 実視等級に基づくサイズ変化
interpolate式を使って、等級(明るさ)に応じて星のサイズを変化させます。
等級が小さいほど明るい(大きい)星になります。
'circle-radius': [
    'interpolate',
    ['linear'],
    ['get', 'mag'],
    -1.5, 8,    // -1.5等星 → 半径8px(シリウスなど)
     0.0, 7,    //  0.0等星 → 半径7px
     1.0, 6,    //  1等星   → 半径6px
     2.0, 4.5,  //  2等星   → 半径4.5px
     3.0, 3.5,  //  3等星   → 半径3.5px
     4.0, 2.5,  //  4等星   → 半径2.5px
     5.0, 1.8,  //  5等星   → 半径1.8px
     6.0, 1.0   //  6等星   → 半径1px
]
星の色: B-V色指数に基づく色温度表現
B-V色指数は星の表面温度を示す指標です。負の値ほど青く高温、正の値ほど赤く低温です。
'circle-color': [
    'interpolate',
    ['linear'],
    ['get', 'bv'],
    -0.4, '#9BB2FF',  // 青白(O型星・リゲル)
    -0.2, '#AABfFF',  // 青(B型星・スピカ)
     0.0, '#CAD8FF',  // 白青(A型星・ベガ)
     0.3, '#F8F7FF',  // 白(F型星・プロキオン)
     0.6, '#FFF4E8',  // 黄白(G型星・太陽)
     0.9, '#FFE4B5',  // 黄(K型星・カペラ)
     1.2, '#FFD2A1',  // 橙(K型星・アルデバラン)
     1.5, '#FFBD6F',  // 赤橙(M型星・アンタレス)
     2.0, '#FF9030'   // 赤(M型星)
]
完全なレイヤー設定
map.on('load', () => {
    // データソースを追加
    map.addSource('stars', {
        type: 'geojson',
        data: './stars.geojson',
        cluster: false,
        tolerance: 0
    });

    // 星レイヤーを追加
    map.addLayer({
        id: 'stars-layer',
        type: 'circle',
        source: 'stars',
        paint: {
            'circle-radius': [/* 上記の大きさ設定 */],
            'circle-color': [/* 上記の色設定 */],
            'circle-opacity': 0.9,
            'circle-blur': 0.15,  // 星のにじみ効果
            'circle-stroke-width': 0
        }
    });
});
Step 4: インタラクティブ機能の追加
プロジェクション切り替え
MapLibre GL JS v5では、MercatorとGlobeプロジェクションを動的に切り替えられます。
function setupProjectionToggle() {
    const mercatorBtn = document.getElementById('mercator-btn');
    const globeBtn = document.getElementById('globe-btn');

    mercatorBtn.addEventListener('click', () => {
        map.setProjection({ type: 'mercator' });
        mercatorBtn.classList.add('active');
        globeBtn.classList.remove('active');
    });

    globeBtn.addEventListener('click', () => {
        map.setProjection({ type: 'globe' });
        globeBtn.classList.add('active');
        mercatorBtn.classList.remove('active');
    });
}
星の詳細情報ポップアップ
map.on('click', 'stars-layer', (e) => {
    const coordinates = e.features[0].geometry.coordinates.slice();
    const properties = e.features[0].properties;

    new maplibregl.Popup()
        .setLngLat(coordinates)
        .setHTML(`
            <strong>HIP ${properties.id}</strong><br>
            等級: ${properties.mag.toFixed(2)}<br>
            B-V: ${properties.bv.toFixed(2)}
        `)
        .addTo(map);
});
Step 5: スタイリング
真っ黒な背景でも見やすい情報パネルとボタンのスタイルを設定します。
body {
    margin: 0;
    padding: 0;
    background-color: #000000;
    font-family: 'Segoe UI', Tahoma, Geneva, Verdana, sans-serif;
}

#map {
    position: absolute;
    top: 0;
    bottom: 0;
    width: 100%;
    background-color: #000000;
}

#info {
    position: absolute;
    top: 20px;
    left: 20px;
    background-color: rgba(0, 0, 0, 0.85);
    color: #ffffff;
    padding: 15px 20px;
    border-radius: 8px;
    border: 1px solid #333333;
}

#projection-toggle button.active {
    background-color: rgba(100, 150, 255, 0.9);
    color: #ffffff;
    font-weight: 600;
}
実行方法
1. データ変換
pip install pandas
python convert_stars.py
2. ローカルサーバー起動
python -m http.server 8000
3. ブラウザで表示
http://localhost:8000
技術的な工夫ポイント
1. 座標系の反転
天球座標と地図座標の向きの違いを考慮し、赤経を反転させることで正しい配置を実現しています。
2. パフォーマンス最適化
- 6等星以下でフィルタリング(118,000 → 約9,000個に削減)
-
cluster: falseでクラスタリングを無効化 -
tolerance: 0で座標精度を維持
3. 科学的な色表現
天文学的な観測に基づくB-V色指数と色温度の対応関係を再現しています。
4. 投影の切り替え
MercatorとGlobeの投影法の切り替えに対応しております。
応用例
今回のコードをベースに、以下のような応用が可能です:
- 星座線の描画: LineString GeoJSONで星座を結ぶ
- 星座名ラベル: Symbol レイヤーで星座名を表示
- 時刻による星の動き: アニメーション機能で星の日周運動を再現
- 検索機能: 特定の星や星座を検索して飛ぶ
- 等級フィルター: スライダーで表示する星の等級範囲を調整
まとめ
MapLibre GL JSのData-Driven Stylingを活用することで、地図ライブラリを天文データの可視化に応用できました。
作成したコード
作成したコード
convert_stars.py
import pandas as pd
import json

print("CSVファイルを読み込み中...")

# CSVの読み込み(ヘッダーなし、エラー行をスキップ)
df = pd.read_csv('hip.csv', header=None, on_bad_lines='skip', engine='python')

print(f"読み込んだ行数: {len(df)}")
print(f"カラム数: {df.shape[1]}")

# カラム名を割り当て(最初の14カラムのみ使用)
expected_cols = ['HIP_ID', 'RA_h', 'RA_m', 'RA_s', 'Dec_sign', 'Dec_d',
                 'Dec_m', 'Dec_s', 'Vmag', 'SpType', 'Col10', 'Col11',
                 'BV', 'Col13']

# カラム数が14を超える場合は最初の14カラムのみ使用
if df.shape[1] > 14:
    df = df.iloc[:, :14]
elif df.shape[1] < 14:
    print(f"警告: カラム数が不足しています ({df.shape[1]} < 14)")

df.columns = expected_cols

# 等級6.0以下でフィルタリング
df = df[df['Vmag'] <= 6.0].copy()
print(f"フィルタ後の星の数: {len(df)}")

# 座標変換関数
def convert_coordinates(row):
    try:
        # 赤経を度数法に変換
        ra_deg = (float(row['RA_h']) + float(row['RA_m'])/60 +
                  float(row['RA_s'])/3600) * 15

        # 赤緯を度数法に変換(符号を適用)
        dec_deg = float(row['Dec_sign']) * (float(row['Dec_d']) +
                  float(row['Dec_m'])/60 + float(row['Dec_s'])/3600)

        # 地図投影用に経度を反転
        lon = -ra_deg
        if lon < -180:
            lon = lon + 360

        lat = dec_deg

        return lon, lat
    except (ValueError, TypeError):
        return None, None

# B-V色指数のクリーニング
def clean_bv(value):
    try:
        bv = float(value)
        # 異常値のクリッピング
        return max(-0.5, min(2.5, bv))
    except (ValueError, TypeError):
        return 0.6  # デフォルト値(白色星)

# GeoJSON Features生成
features = []
skipped = 0
for idx, row in df.iterrows():
    try:
        lon, lat = convert_coordinates(row)

        # 座標変換に失敗した場合はスキップ
        if lon is None or lat is None:
            skipped += 1
            continue

        bv = clean_bv(row['BV'])

        feature = {
            "type": "Feature",
            "geometry": {
                "type": "Point",
                "coordinates": [lon, lat]
            },
            "properties": {
                "id": int(row['HIP_ID']),
                "mag": float(row['Vmag']),
                "bv": bv
            }
        }
        features.append(feature)
    except Exception as e:
        skipped += 1
        continue

print(f"変換成功: {len(features)}個")
print(f"スキップ: {skipped}個")

# GeoJSON作成
geojson = {
    "type": "FeatureCollection",
    "features": features
}

# ファイル出力
with open('stars.geojson', 'w', encoding='utf-8') as f:
    json.dump(geojson, f, ensure_ascii=False, indent=2)

print(f"変換完了: {len(features)}個の星をstars.geojsonに出力しました")
app.js
// MapLibre GL JSの初期化
const map = new maplibregl.Map({
    container: 'map',
    style: {
        version: 8,
        sources: {},
        layers: [{
            id: 'background',
            type: 'background',
            paint: {
                'background-color': '#000000'
            }
        }],
        projection: {
            type: 'mercator'
        }
    },
    center: [0, 0],
    zoom: 1.5,
    maxZoom: 10,
    minZoom: 0,
    renderWorldCopies: true
});

// エラーハンドリング
map.on('error', (e) => {
    console.error('マップエラー:', e);
    if (e.error && e.error.message && e.error.message.includes('stars.geojson')) {
        alert('stars.geojsonが見つかりません。先にconvert_stars.pyを実行してください。');
    }
});

// 星レイヤーのセットアップ関数
function setupStarsLayer() {
    // 星データソースを追加
    map.addSource('stars', {
        type: 'geojson',
        data: './stars.geojson',
        cluster: false,
        tolerance: 0
    });

    // 星レイヤーを追加
    map.addLayer({
        id: 'stars-layer',
        type: 'circle',
        source: 'stars',
        paint: {
            'circle-radius': [
                'interpolate',
                ['linear'],
                ['get', 'mag'],
                -1.5, 8,
                0.0, 7,
                1.0, 6,
                2.0, 4.5,
                3.0, 3.5,
                4.0, 2.5,
                5.0, 1.8,
                6.0, 1.0
            ],
            'circle-color': [
                'interpolate',
                ['linear'],
                ['get', 'bv'],
                -0.4, '#9BB2FF',
                -0.2, '#AABfFF',
                0.0, '#CAD8FF',
                0.3, '#F8F7FF',
                0.6, '#FFF4E8',
                0.9, '#FFE4B5',
                1.2, '#FFD2A1',
                1.5, '#FFBD6F',
                2.0, '#FF9030'
            ],
            'circle-opacity': 0.9,
            'circle-blur': 0.15,
            'circle-stroke-width': 0
        }
    });

    // インタラクション設定
    map.on('mouseenter', 'stars-layer', () => {
        map.getCanvas().style.cursor = 'pointer';
    });

    map.on('mouseleave', 'stars-layer', () => {
        map.getCanvas().style.cursor = '';
    });

    map.on('click', 'stars-layer', (e) => {
        const coordinates = e.features[0].geometry.coordinates.slice();
        const properties = e.features[0].properties;

        while (Math.abs(e.lngLat.lng - coordinates[0]) > 180) {
            coordinates[0] += e.lngLat.lng > coordinates[0] ? 360 : -360;
        }

        new maplibregl.Popup()
            .setLngLat(coordinates)
            .setHTML(`
                <strong>HIP ${properties.id}</strong><br>
                等級: ${properties.mag.toFixed(2)}<br>
                B-V: ${properties.bv.toFixed(2)}<br>
                色: ${getStarColorName(properties.bv)}
            `)
            .addTo(map);
    });
}

// 初期ロード時の処理
map.on('load', () => {
    setupStarsLayer();
    setupProjectionToggle();
    console.log('星図マップの初期化が完了しました');
});

// プロジェクション切り替え機能のセットアップ
function setupProjectionToggle() {
    const mercatorBtn = document.getElementById('mercator-btn');
    const globeBtn = document.getElementById('globe-btn');

    // Mercatorボタンのクリックイベント
    mercatorBtn.addEventListener('click', () => {
        if (!mercatorBtn.classList.contains('active')) {
            map.setProjection({ type: 'mercator' });
            mercatorBtn.classList.add('active');
            globeBtn.classList.remove('active');
            console.log('プロジェクションをMercatorに変更しました');
        }
    });

    // Globeボタンのクリックイベント
    globeBtn.addEventListener('click', () => {
        if (!globeBtn.classList.contains('active')) {
            map.setProjection({ type: 'globe' });
            globeBtn.classList.add('active');
            mercatorBtn.classList.remove('active');
            console.log('プロジェクションをGlobeに変更しました');
        }
    });
}

// B-V値から星の色名を取得する補助関数
function getStarColorName(bv) {
    if (bv < -0.3) return '青白';
    if (bv < -0.1) return '青';
    if (bv < 0.15) return '白青';
    if (bv < 0.45) return '白';
    if (bv < 0.75) return '黄白';
    if (bv < 1.05) return '黄';
    if (bv < 1.35) return '橙';
    if (bv < 1.75) return '赤橙';
    return '赤';
}
参考資料