はじめに
- Python3で簡単にデータを可視化できるAPI「Streamlit」を使ってみます
- 対象となるデータはNHKが公開しているコロナウイルスの県別新規感染者数データです
- 本記事ではStreamlitをEC2サーバで稼働させ、Webアプリケーションとして公開する手順を書きます
- VPCやEC2の構築方法については過去記事をご参照ください
- ソースコードはGitHubで公開しているので、ご自由にcloneして試してみてください
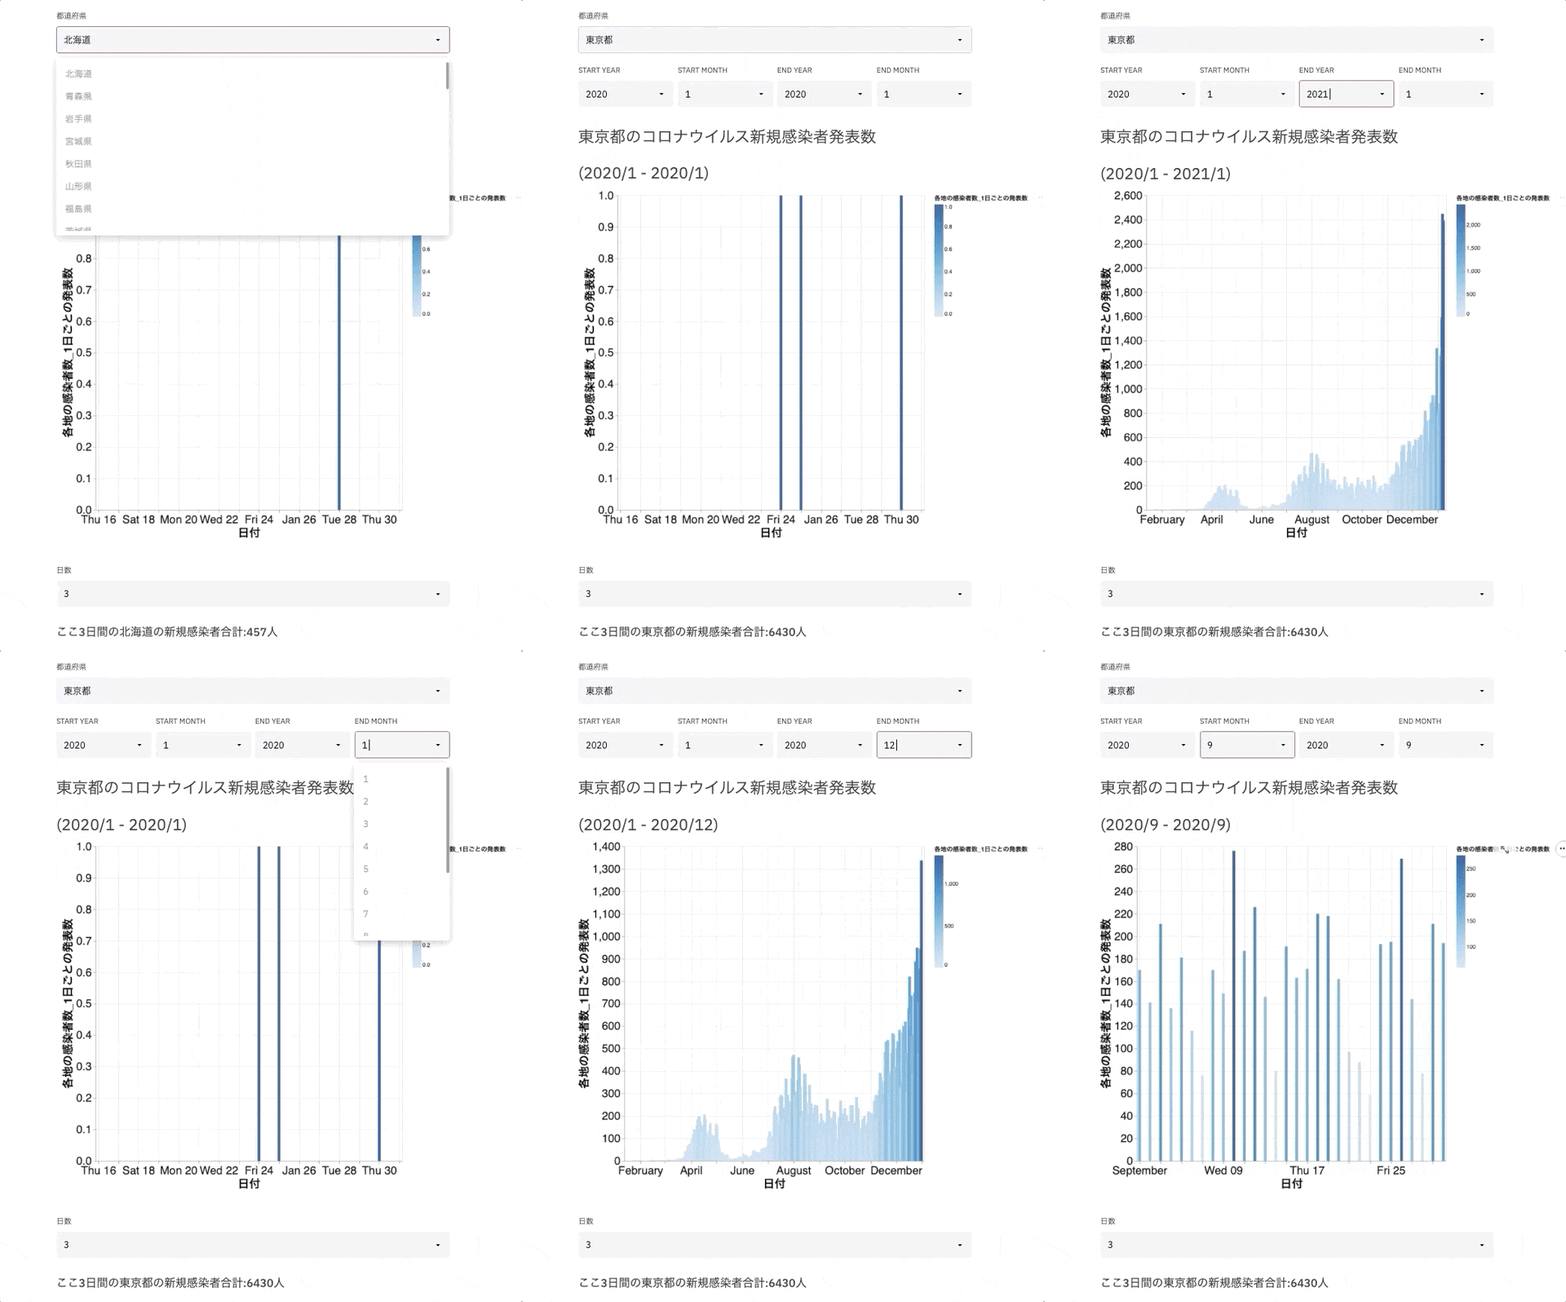
完成イメージ
環境構築
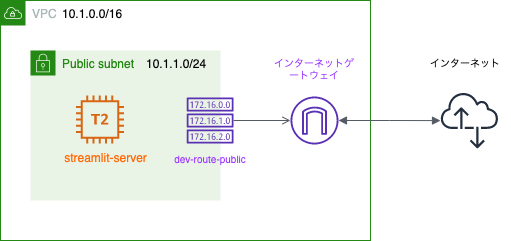
ネットワーク構成図
streamlit-serverインスタンスの生成
- EC2サービス
- [左タブ] インスタンス
- 下記設定のみ変更し、他はデフォルトでインスタンスを作る
インスタンスの詳細の設定
- ネットワーク: Develop(10.1.0.0/16)
- サブネット: public-subnet-1a-dev
- 自動割り当てパブリックIP: 有効
タグの追加
- タグの追加
- キー: Name
- 値: Streamlit-server
セキュリティグループの設定
キーペア
- 既存のキーを使うことを想定
- セッションマネージャーによるアクセスでもよい
Streamlitをインストールする
- streamlit-serverインスタンスにSSHアクセスする(セッションマネージャーでもよい)
- ssh -i ~/.ssh/develop.pem ec2-user@[パブリックIPv4アドレス]
- Streamlitをインストールする(Amazon Linux2を想定)
sudo suyum update -yyum install python3 -ypip3 install streamlit
Streamlitを動かす
データのダウンロード
県別コロナ新規感染者数のデータ
- HNKさんが公開しているデータを落とす
-
https://www3.nhk.or.jp/n-data/opendata/coronavirus/nhk_news_covid19_prefectures_daily_data.csv
-
linuxならば下記コマンドでカレントディレクトリに落とせる
curl -O https://www3.nhk.or.jp/n-data/opendata/coronavirus/nhk_news_covid19_prefectures_daily_data.csv
-
-
corona.pyと同じディレクトリにmvする
都道府県別の人口データ
- 都道府県別の人口に対する感染者比率を計算するときに使う
- e-Statさんから落としたデータをscpなどで飛ばす
- ファイル名を
population.csvに変更するmv c01.csv population.csv
-
corona.pyと同じディレクトリにmvする
ディレクトリ構造のイメージ
プログラミング
必要なライブラリのインポート
- 今回はstreamlitに加えて下記ライブラリもimport
-
pandas:データ操作
-
altair:グラフ描画
-
datetime:日付を扱う
-
calendar:最終日が欲しいときに使う
import pandas as pd
import streamlit as st
import altair as alt  # グラフを描画するためのパッケージ
import datetime as dt  # 日付を扱う
import calendar  # 最終日が欲しいときに使う
-
「今年」「今月」を保持しておく
-
セレクトボックスの日付指定のときに使う
THIS_YEAR = dt.datetime.today().year
THIS_MONTH = dt.datetime.today().month
年と月の範囲を保持しておく
-
年:2020年 - 今年
-
月:1 - 12月
RANGE_YEAR = list(range(2020, THIS_YEAR + 1))
RANGE_MONTH = list(range(1, 13, 1))
データの読み込み
- 県別コロナ新規感染者数
- 都道府県名
-
DF['都道府県名'].uniqueで重複をなくせば簡単に取れるDF_CORONA_JAPAN = pd.read_csv( 'nhk_news_covid19_prefectures_daily_data.csv') # コロナウイルス感染者数のデータを読み込む PREFACTURES = DF_CORONA_JAPAN['都道府県名'].unique() # セレクトボックス用に都道府県名リストを取得しておく
-
- 都道府県別の人口
- 2015年のデータに絞って取得
# 2015年の国勢調査から都道府県別人口DFを獲得
DF_POPURATION = pd.read_csv('population.csv', encoding='cp932')
DF_POPURATION_HEISEI_LATEST = DF_POPURATION[DF_POPURATION['西暦(年)'] == 2015]
- 2015年のデータに絞って取得
県別の新規感染者グラフ作成グラフ
-
コンストラクタ
- 県別感染者データを受け取り、保持
-
alt_graphメソッド
- 対象期間の新規感染者のグラフ描画するメソッド
-
get_ndays_cumメソッド
- 直近ndaysの新規感染者の合計を返すメソッド
class PrefactureGraphMaker():
    '''新規感染者のグラフを作成するクラス'''
    def __init__(self, df_prefacture):
        self.df_prefacture = df_prefacture

    def alt_graph(self, term):
        '''指定された期間のコロナウイルス新規感染者のグラフを描画するメソッド'''

        start = self.df_prefacture['日付'] >= term.start_datetime
        end = self.df_prefacture['日付'] <= term.end_datetime
        df_term = self.df_prefacture[start == end]  #
        graph_slider = alt.Chart(df_term).mark_bar().encode(
            x='日付', y='各地の感染者数_1日ごとの発表数', color='各地の感染者数_1日ごとの発表数').properties(
                width=800, height=640).configure_axis(labelFontSize=20,
                                                      titleFontSize=20)
        st.altair_chart(graph_slider)

    def get_ndays_cum(self, ndays):
        '''直近ndaysの新規感染者の合計を返すメソッド'''
        return sum(self.df_prefacture.tail(ndays)['各地の感染者数_1日ごとの発表数'])
期間指定用セレクトボックスを配置するクラス
-
コンストラクタ
- 並列にセレクトボックスを配置
- 描画期間の初めと終わりを設定する
-
start_month_rangeメソッド
- 「初めの年」が今年ならば、現在の月までしか表示しない
-
end_year_rangeメソッド、end_month_rangeメソッド
- 「START YEAR/MONTH」よりも前の期間を表示しない
class TermSelectBox():
    '''表示する期間を選択するテキストボックスを管理するクラス'''
    def __init__(self):
        '''横一列にセレクトボックス配置'''
        self.col1, self.col2, self.col3, self.col4 = st.beta_columns(4)

        self.start_year = self.col1.selectbox(
            'START YEAR',
            RANGE_YEAR,
        )
        # strat_yearに合わせて表示範囲を調整
        self.start_month = self.start_month_range()
        self.end_year = self.end_year_range()
        self.end_month = self.end_month_range()

        # start_year年 / start_month月 / 1日 のdatetime
        self.start_datetime = dt.datetime(self.start_year, self.start_month, 1)
        # end_year / end_month / その月の最終日 のdatetime (最終日は月によって異なるので)
        self.end_datetime = dt.datetime(
            self.end_year, self.end_month,
            get_last_date(self.end_year, self.end_month))

    def start_month_range(self):
        '''start yearが今年だったら、今月までしか表示しない'''
        if self.start_year == THIS_YEAR:
            return self.col2.selectbox('START MONTH', RANGE_MONTH[:THIS_MONTH])
        else:
            return self.col2.selectbox('START MONTH', RANGE_MONTH)

    def end_year_range(self):
        '''年を自動的に期間の初めよりも後にする'''
        return self.col3.selectbox(
            'END YEAR', RANGE_YEAR[RANGE_YEAR.index(self.start_year):])

    def end_month_range(self):
        '''月を自動的に「初めの月」よりも後にする'''
        if self.start_year == THIS_YEAR:
            if self.start_year == self.end_year:
                return self.col4.selectbox(
                    'END MONTH', RANGE_MONTH[self.start_month - 1:THIS_MONTH])
            else:
                return self.col4.selectbox('END MONTH',
                                           RANGE_MONTH[:THIS_MONTH])
        else:
            if self.start_year == self.end_year:
                return self.col4.selectbox('END MONTH',
                                           RANGE_MONTH[self.start_month - 1:])
            else:
                return self.col4.selectbox('END MONTH',
                                           RANGE_MONTH[:THIS_MONTH])
main関数
- インスタンスを生成して、やりたいようにメソッドを呼んであげれば完成
if __name__ == "__main__":
    prefacture_name = st.selectbox('都道府県',
                                   (PREFACTURES))  # 都道府県が選べるセレクトボックスを定義
    df_prefacture = extract_prefacture_data(DF_CORONA_JAPAN,
                                            prefacture_name)  # DFから都道府県データを抽出

    _term_sb = TermSelectBox()  # 期間設定用セレクトボックスを定義

    write_prefacture_graph_title(prefacture_name, _term_sb)  # グラフのタイトルと期間を表示

    gm_n = PrefactureGraphMaker(df_prefacture)  # グラフ描画用インスタンス
    gm_n.alt_graph(_term_sb)  # 期間を与えてグラフを描画

    ndays = st.selectbox("日数", range(1, 31, 1), index=2)

    df_population_prefacture = DF_POPURATION_LATEST[
        DF_POPURATION_LATEST['都道府県名'] == prefacture_name]['人口(総数)']

    st.write('### ここ' + str(ndays) + '日間の' + prefacture_name + 'の新規感染者合計:' +
             str(gm_n.get_ndays_cum(ndays)) + '人')

    ndays_per_population = (gm_n.get_ndays_cum(ndays) /
                            int(df_population_prefacture)) * 100

    st.write('### ' + prefacture_name + 'の人口の' +
             str(ndays_per_population)[:5] + '%(1万あたり約' +
             str(round(ndays_per_population * 100))[:4] + '人)')
実行
-
streamlit run corona.pyで実行You can now view your Streamlit app in your browser. Network URL: http://[プライベートIP]:8501 External URL: http://[パブリックIP]:8501 -
ローカルのブラウザで
http://[パブリックIP]:8501にアクセスしてみる- アプリケーションが表示できれば成功
終わりに
- Streamlitを用いることで時間をかけずに簡単なデータの可視化することができました
- 間違いや改善点等ありましたらコメントいただければ幸いです


