はじめに
時系列データの分析は、ビジネス、金融、科学研究など、様々な分野で重要な役割を果たしています。その中でも、移動平均は最も基本的かつ強力なツールの一つです。この記事では、Pandasを使用した移動平均の計算と可視化について、基礎から応用まで幅広く解説します。
この記事を読むメリット
-
実践的なデータ分析スキルの向上: 単純な移動平均から適応型移動平均まで、様々な手法の実装方法を学べます。これらのスキルは、株価予測、需要予測、センサーデータの分析など、実務で即座に活用できます。
-
効率的なコード設計とパフォーマンス最適化: 大規模データセットの処理技術や、再利用性の高いコード設計について学べます。これにより、より効率的で保守性の高い分析プログラムを作成できるようになります。
-
分析手法と可視化技術の習得: 移動平均の交差シグナルやボリンジャーバンドなど、分析手法と、それらを効果的に可視化する技術を学べます。これにより、データからより深い洞察を得て、説得力のある分析結果を提示できるようになります。
この記事を通じて、時系列データ分析の実践的スキルを身につけ、より効率的で洞察力のある分析を行う能力を獲得できます。さらに、ここで学ぶテクニックは、機械学習モデルの特徴量エンジニアリングにも応用可能で、予測モデルの精度向上にも貢献します。
基本的な実装
まずは基本的な実装から始めましょう。
import pandas as pd
import numpy as np
import matplotlib.pyplot as plt
from typing import Union

# サンプルデータの作成
def create_sample_data(start: str = '2023-01-01', end: str = '2023-12-31', freq: str = 'D') -> pd.DataFrame:
    dates = pd.date_range(start=start, end=end, freq=freq)
    np.random.seed(42)
    values = np.random.randn(len(dates)) * 10 + 100
    df = pd.DataFrame({'date': dates, 'value': values})
    return df.set_index('date')

# 移動平均の計算
def calculate_moving_average(df: pd.DataFrame, column: str, window: int) -> pd.Series:
    return df[column].rolling(window=window, min_periods=1).mean()

# データの可視化
def plot_time_series(df: pd.DataFrame, title: str):
    plt.figure(figsize=(12, 6))
    plt.plot(df.index, df['value'], label='Original Data')
    plt.plot(df.index, df['MA7'], label='7-day MA')
    plt.plot(df.index, df['MA30'], label='30-day MA')
    plt.title(title)
    plt.xlabel('Date')
    plt.ylabel('Value')
    plt.legend()
    plt.grid(True)
    plt.show()

# メイン処理
df = create_sample_data()
df['MA7'] = calculate_moving_average(df, 'value', 7)
df['MA30'] = calculate_moving_average(df, 'value', 30)
plot_time_series(df, 'Time Series Data with Moving Averages')
応用例
ここでは、さまざまな応用的な移動平均テクニックの実装と結果の可視化を行います。
import pandas as pd
import numpy as np
import matplotlib.pyplot as plt

# サンプルデータの作成(ランダムウォーク)
def create_sample_data(start: str = '2023-01-01', end: str = '2023-12-31', freq: str = 'D') -> pd.DataFrame:
    dates = pd.date_range(start=start, end=end, freq=freq)
    np.random.seed(42)
    values = np.cumsum(np.random.randn(len(dates))) + 100  # ランダムウォーク
    df = pd.DataFrame({'date': dates, 'value': values})
    return df.set_index('date')

# 1. 適応型移動平均(Adaptive Moving Average)
def adaptive_moving_average(df: pd.DataFrame, column: str, min_window: int, max_window: int) -> pd.Series:
    volatility = df[column].rolling(window=min_window).std()
    volatility = volatility.fillna(method='ffill').fillna(method='bfill')

    if volatility.max() == volatility.min():
        normalized_volatility = pd.Series(0.5, index=volatility.index)
    else:
        normalized_volatility = (volatility - volatility.min()) / (volatility.max() - volatility.min())

    window_size = min_window + (max_window - min_window) * (1 - normalized_volatility)
    window_size = window_size.clip(lower=min_window, upper=max_window).round().astype(int)

    result = pd.Series(index=df.index, dtype=float)
    for size in range(min_window, max_window + 1):
        mask = window_size == size
        if mask.any():
            result[mask] = df.loc[mask, column].rolling(window=size, min_periods=1).mean()

    return result

# 2. 重み付き移動平均(Weighted Moving Average)
def weighted_moving_average(df: pd.DataFrame, column: str, window: int) -> pd.Series:
    weights = np.arange(1, window + 1)
    return df[column].rolling(window=window).apply(lambda x: np.dot(x, weights) / weights.sum(), raw=True)

# 3. 中央値ベースの移動平均(Median-based Moving Average)
def median_moving_average(df: pd.DataFrame, column: str, window: int) -> pd.Series:
    return df[column].rolling(window=window, min_periods=1).median()

# サンプルデータの作成
df = create_sample_data()

# 各種移動平均の計算
df['SMA7'] = df['value'].rolling(window=7).mean()
df['SMA30'] = df['value'].rolling(window=30).mean()
df['AMA'] = adaptive_moving_average(df, 'value', 7, 30)
df['WMA7'] = weighted_moving_average(df, 'value', 7)
df['MedMA7'] = median_moving_average(df, 'value', 7)

# 結果の可視化
plt.figure(figsize=(15, 10))

plt.subplot(2, 1, 1)
plt.plot(df.index, df['value'], label='Original Data', alpha=0.5)
plt.plot(df.index, df['SMA7'], label='Simple MA (7)', linestyle='--')
plt.plot(df.index, df['SMA30'], label='Simple MA (30)', linestyle='--')
plt.plot(df.index, df['AMA'], label='Adaptive MA (7-30)', linewidth=2)
plt.title('Comparison of Simple and Adaptive Moving Averages')
plt.xlabel('Date')
plt.ylabel('Value')
plt.legend()
plt.grid(True)

plt.subplot(2, 1, 2)
plt.plot(df.index, df['value'], label='Original Data', alpha=0.5)
plt.plot(df.index, df['SMA7'], label='Simple MA (7)', linestyle='--')
plt.plot(df.index, df['WMA7'], label='Weighted MA (7)', linewidth=2)
plt.plot(df.index, df['MedMA7'], label='Median-based MA (7)', linewidth=2)
plt.title('Comparison of Simple, Weighted, and Median-based Moving Averages')
plt.xlabel('Date')
plt.ylabel('Value')
plt.legend()
plt.grid(True)

plt.tight_layout()
plt.show()

# 適応型移動平均の窓サイズの変化を確認
window_sizes = (df['AMA'] - df['value'].shift(1)) / (df['value'] - df['value'].shift(1))
window_sizes = window_sizes.clip(lower=7, upper=30)

plt.figure(figsize=(12, 6))
plt.plot(df.index, window_sizes, label='Adaptive Window Size')
plt.title('Adaptive Moving Average Window Size')
plt.xlabel('Date')
plt.ylabel('Window Size')
plt.ylim(5, 32)
plt.legend()
plt.grid(True)
plt.show()

# 結果の一部を表示
print(df[['value', 'SMA7', 'SMA30', 'AMA', 'WMA7', 'MedMA7']].head(10))
print("\n")
print(df[['value', 'SMA7', 'SMA30', 'AMA', 'WMA7', 'MedMA7']].tail(10))
                value        SMA7  SMA30         AMA        WMA7      MedMA7
date
2023-01-01  100.496714         NaN    NaN  100.496714         NaN  100.496714
2023-01-02  100.358450         NaN    NaN  100.427582         NaN  100.427582
2023-01-03  101.006138         NaN    NaN  100.620434         NaN  100.496714
2023-01-04  102.529168         NaN    NaN  101.097618         NaN  100.751426
2023-01-05  102.295015         NaN    NaN  101.337097         NaN  101.006138
2023-01-06  102.060878         NaN    NaN  101.457727         NaN  101.533508
2023-01-07  103.640091  101.769493    NaN  101.769493  102.273917  102.060878
2023-01-08  104.407525  102.328181    NaN  104.407525  102.933425  102.295015
2023-01-09  103.938051  102.839552    NaN  102.040563  103.335893  102.529168
2023-01-10  104.480611  103.335906    NaN  104.480611  103.746157  103.640091


                 value        SMA7       SMA30         AMA        WMA7  \
date
2023-12-22  101.406940  101.537713  103.930891   98.601433  101.873183
2023-12-23  101.388427  101.743988  103.818912   99.442476  101.835862
2023-12-24  101.099768  101.864611  103.670923   98.358846  101.674807
2023-12-25  101.422487  101.820572  103.512887   98.703919  101.564275
2023-12-26  100.595256  101.535833  103.306332   98.885773  101.257947
2023-12-27  101.114602  101.348136  103.117496  100.397922  101.152639
2023-12-28  102.647341  101.382117  103.009661   99.126103  101.477440
2023-12-29  102.538581  101.543780  102.895673   99.765899  101.766556
2023-12-30  102.940293  101.765475  102.817648   95.711616  102.115684
2023-12-31  103.630437  102.127000  102.730123   94.290223  102.581925

                MedMA7
date
2023-12-22  101.730764
2023-12-23  101.730764
2023-12-24  101.730764
2023-12-25  101.422487
2023-12-26  101.406940
2023-12-27  101.388427
2023-12-28  101.388427
2023-12-29  101.388427
2023-12-30  101.422487
2023-12-31  102.538581
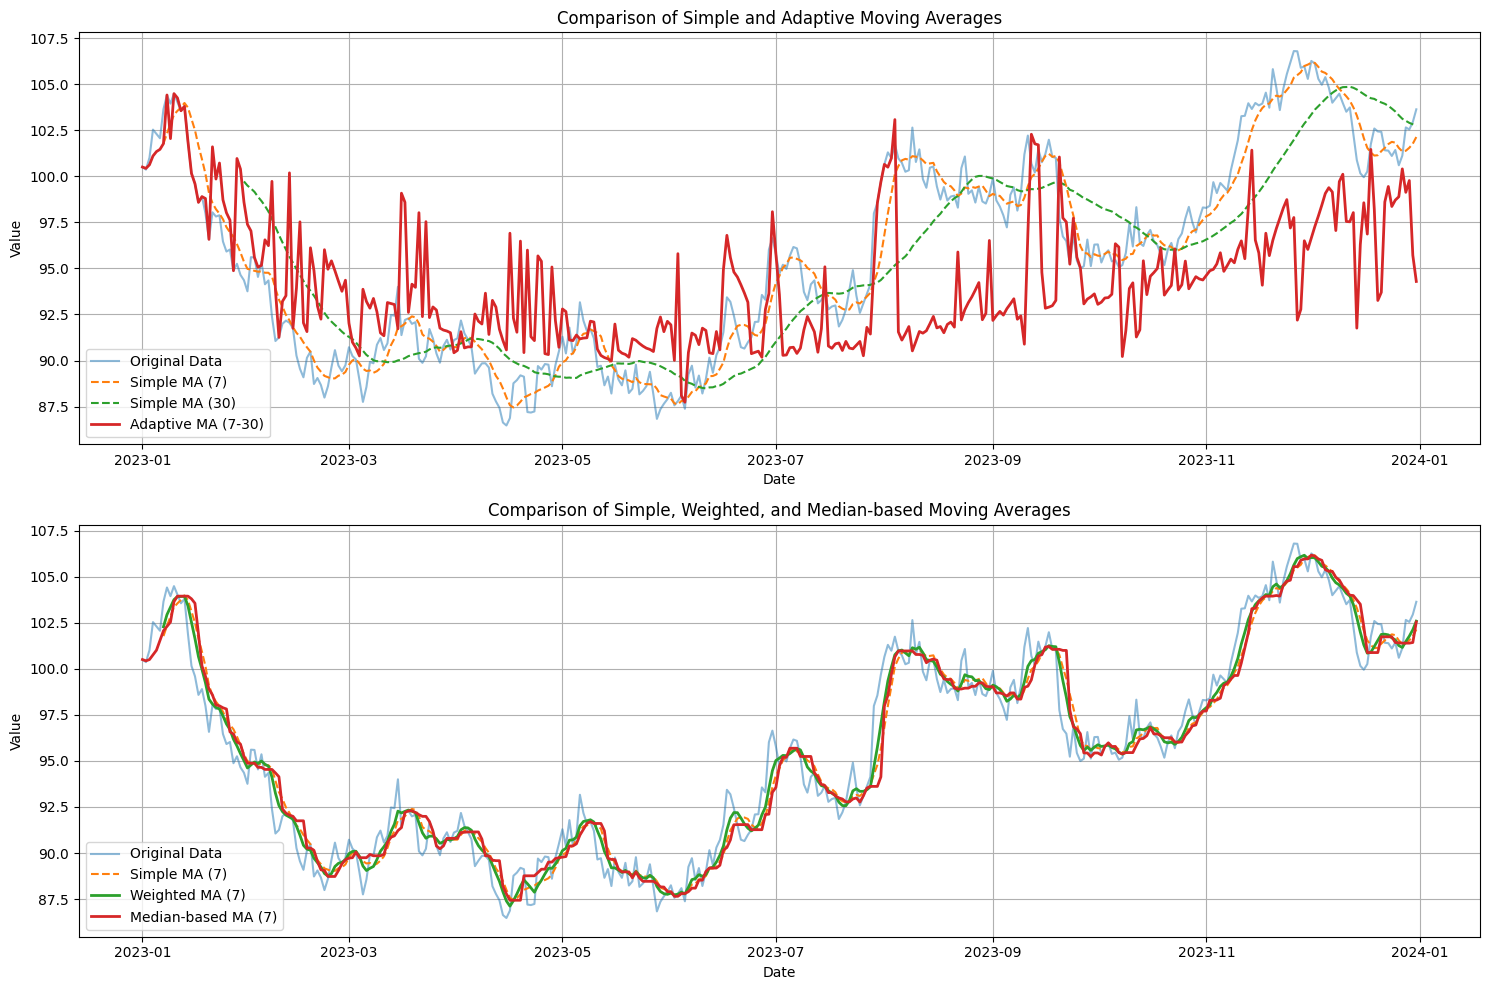
この実装では、以下の移動平均手法を比較しています:
- 単純移動平均(SMA): 7日と30日の窓サイズで計算しています。
- 適応型移動平均(AMA): 窓サイズを7日から30日の間で動的に調整します。
- 重み付き移動平均(WMA): 7日の窓サイズで、最新のデータにより大きな重みを付けています。
- 中央値ベースの移動平均(MedMA): 7日の窓サイズで、中央値を使用しています。
結果の可視化では、2つのグラフを作成しています:
- 単純移動平均と適応型移動平均の比較
- 単純移動平均、重み付き移動平均、中央値ベースの移動平均の比較
また、適応型移動平均の窓サイズの変化を別のグラフで示しています。
これらのグラフを比較することで、各手法の特徴や違いを視覚的に理解することができます:
- 適応型移動平均(AMA): データの変動に応じて窓サイズを調整するため、急激な変化にも柔軟に対応できます。
- 重み付き移動平均(WMA): 最新のデータにより大きな重みを付けるため、トレンドの変化をより早く捉えることができます。
- 中央値ベースの移動平均(MedMA): 外れ値の影響を受けにくいため、ノイズの多いデータに対して効果的です。
最後に、計算結果の一部(最初の10行と最後の10行)を表示しています。これにより、各手法の数値的な違いを直接比較することができます。
この応用例を通じて、それぞれの移動平均手法の特徴や用途をより深く理解することができるでしょう。実際のデータ分析では、データの特性や分析の目的に応じて、最適な手法を選択することが重要です。
パフォーマンス最適化
大規模なデータセットを扱う場合、計算効率が重要になります。以下はパフォーマンスを向上させるためのテクニックです。
1. Numbaを使用した高速化
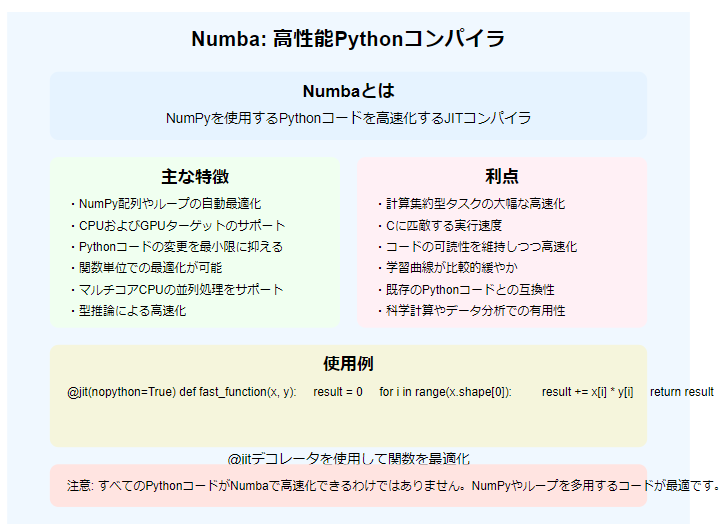
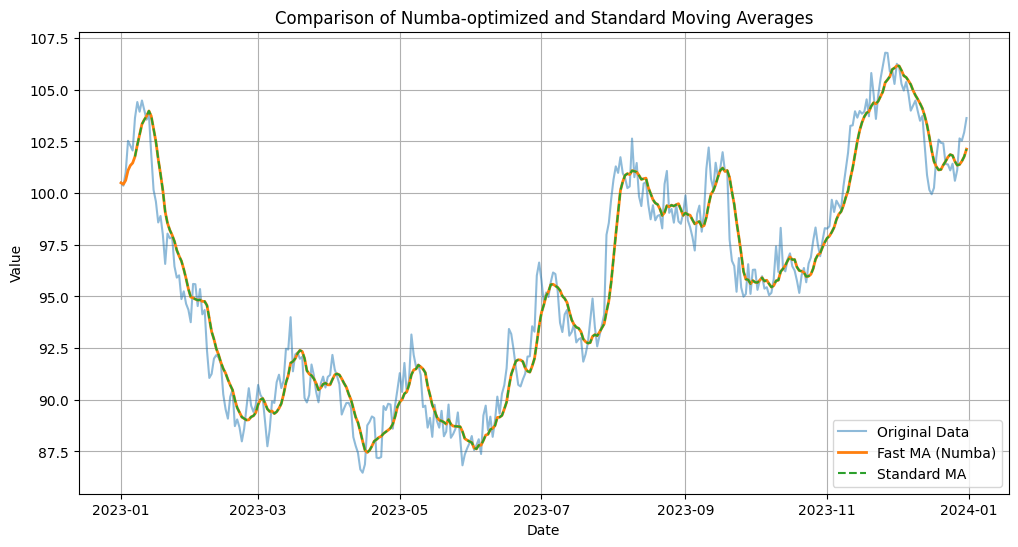
Numbaを使用して、移動平均の計算を高速化できます。
import pandas as pd
import numpy as np
from numba import jit
import matplotlib.pyplot as plt

@jit(nopython=True)
def numba_moving_average(arr, window):
    n = len(arr)
    result = np.empty(n)
    cumsum = np.zeros(n + 1)
    cumsum[1:] = np.cumsum(arr)

    for i in range(n):
        if i < window:
            result[i] = cumsum[i+1] / (i + 1)
        else:
            result[i] = (cumsum[i+1] - cumsum[i+1-window]) / window

    return result

def fast_moving_average(df: pd.DataFrame, column: str, window: int) -> pd.Series:
    values = df[column].values
    ma = numba_moving_average(values, window)
    return pd.Series(ma, index=df.index)

# サンプルデータの作成
def create_sample_data(start: str = '2023-01-01', end: str = '2023-12-31', freq: str = 'D') -> pd.DataFrame:
    dates = pd.date_range(start=start, end=end, freq=freq)
    np.random.seed(42)
    values = np.cumsum(np.random.randn(len(dates))) + 100
    df = pd.DataFrame({'date': dates, 'value': values})
    return df.set_index('date')

# メイン処理
df = create_sample_data()

# Numbaを使用した高速移動平均の計算
df['FastMA7'] = fast_moving_average(df, 'value', 7)

# 標準的なPandasの移動平均計算(比較用)
df['MA7'] = df['value'].rolling(window=7).mean()

# 結果の可視化
plt.figure(figsize=(12, 6))
plt.plot(df.index, df['value'], label='Original Data', alpha=0.5)
plt.plot(df.index, df['FastMA7'], label='Fast MA (Numba)', linewidth=2)
plt.plot(df.index, df['MA7'], label='Standard MA', linestyle='--')
plt.title('Comparison of Numba-optimized and Standard Moving Averages')
plt.xlabel('Date')
plt.ylabel('Value')
plt.legend()
plt.grid(True)
plt.show()

# 計算時間の比較
import time

start_time = time.time()
_ = fast_moving_average(df, 'value', 7)
numba_time = time.time() - start_time

start_time = time.time()
_ = df['value'].rolling(window=7).mean()
pandas_time = time.time() - start_time

print(f"Numba-optimized calculation time: {numba_time:.6f} seconds")
print(f"Standard Pandas calculation time: {pandas_time:.6f} seconds")
print(f"Speedup factor: {pandas_time / numba_time:.2f}x")

# 結果の一部を表示
print("\nFirst few rows of the DataFrame:")
print(df.head())

print("\nLast few rows of the DataFrame:")
print(df.tail())
応用的な分析と可視化
1. 移動平均の交差シグナル
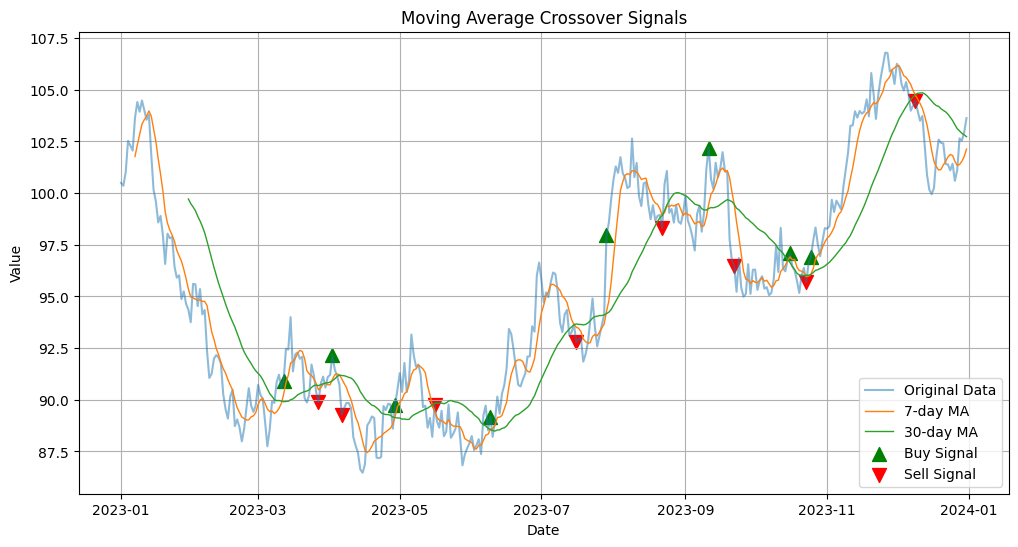
短期と長期の移動平均の交差を用いて、トレンド変化のシグナルを検出します。
import pandas as pd
import numpy as np
import matplotlib.pyplot as plt

def create_sample_data(start: str = '2023-01-01', end: str = '2023-12-31', freq: str = 'D') -> pd.DataFrame:
    dates = pd.date_range(start=start, end=end, freq=freq)
    np.random.seed(42)
    values = np.cumsum(np.random.randn(len(dates))) + 100
    df = pd.DataFrame({'date': dates, 'value': values})
    return df.set_index('date')

def calculate_ma(df: pd.DataFrame, column: str, window: int) -> pd.Series:
    return df[column].rolling(window=window).mean()

def ma_crossover_signal(df: pd.DataFrame, short_window: int, long_window: int) -> pd.DataFrame:
    df['Short_MA'] = calculate_ma(df, 'value', short_window)
    df['Long_MA'] = calculate_ma(df, 'value', long_window)

    # シグナルの計算
    df['Signal'] = np.where(df['Short_MA'] > df['Long_MA'], 1, 0)
    df['Signal'] = df['Signal'].diff()

    return df

def plot_ma_crossover(df: pd.DataFrame):
    plt.figure(figsize=(12, 6))
    plt.plot(df.index, df['value'], label='Original Data', alpha=0.5)
    plt.plot(df.index, df['Short_MA'], label=f'{short_window}-day MA', linewidth=1)
    plt.plot(df.index, df['Long_MA'], label=f'{long_window}-day MA', linewidth=1)

    # 買いシグナル
    plt.scatter(df[df['Signal'] == 1].index,
                df['value'][df['Signal'] == 1],
                marker='^', color='g', s=100, label='Buy Signal')

    # 売りシグナル
    plt.scatter(df[df['Signal'] == -1].index,
                df['value'][df['Signal'] == -1],
                marker='v', color='r', s=100, label='Sell Signal')

    plt.title('Moving Average Crossover Signals')
    plt.xlabel('Date')
    plt.ylabel('Value')
    plt.legend()
    plt.grid(True)
    plt.show()

# メイン処理
if __name__ == "__main__":
    df = create_sample_data()
    short_window = 7
    long_window = 30

    df = ma_crossover_signal(df, short_window, long_window)
    plot_ma_crossover(df)

    # シグナルの統計
    buy_signals = df['Signal'][df['Signal'] == 1].count()
    sell_signals = df['Signal'][df['Signal'] == -1].count()

    print(f"買いシグナル数: {buy_signals}")
    print(f"売りシグナル数: {sell_signals}")

    # 最初と最後の数行を表示
    print("\nデータの最初の数行:")
    print(df.head())
    print("\nデータの最後の数行:")
    print(df.tail())
2. ボリンジャーバンド
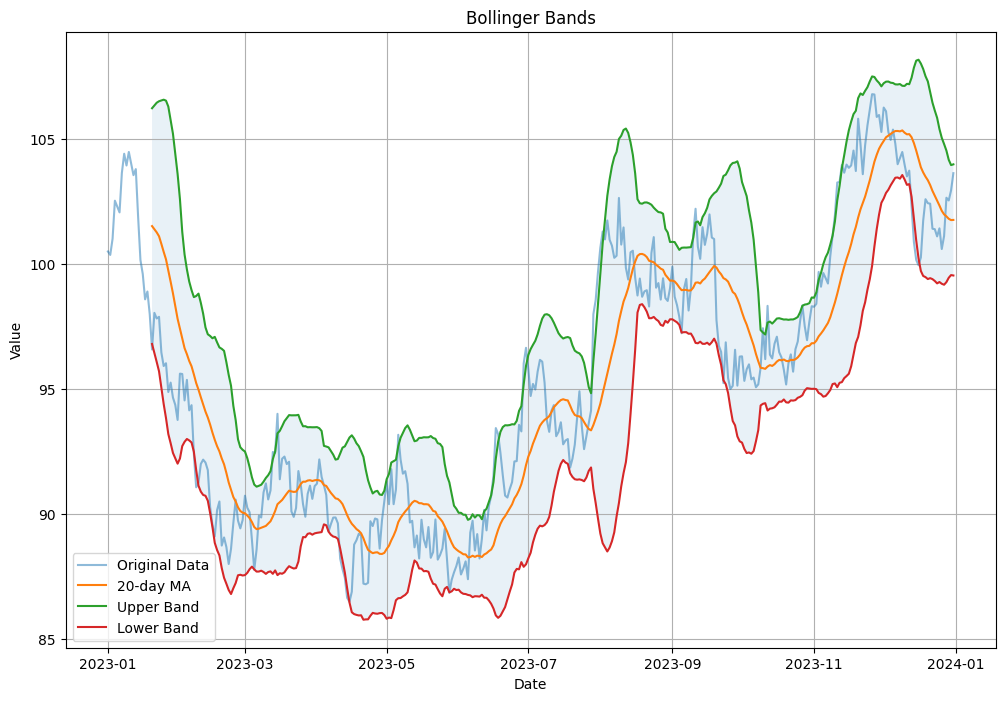
移動平均と標準偏差を使用してボリンジャーバンドを計算し、可視化します。
def bollinger_bands(df: pd.DataFrame, column: str, window: int, num_std: float) -> pd.DataFrame:
    rolling_mean = df[column].rolling(window=window).mean()
    rolling_std = df[column].rolling(window=window).std()
    upper_band = rolling_mean + (rolling_std * num_std)
    lower_band = rolling_mean - (rolling_std * num_std)
    return pd.DataFrame({'Middle': rolling_mean, 'Upper': upper_band, 'Lower': lower_band})

bb = bollinger_bands(df, 'value', 20, 2)
df = pd.concat([df, bb], axis=1)

plt.figure(figsize=(12, 8))
plt.plot(df.index, df['value'], label='Original Data', alpha=0.5)
plt.plot(df.index, df['Middle'], label='20-day MA')
plt.plot(df.index, df['Upper'], label='Upper Band')
plt.plot(df.index, df['Lower'], label='Lower Band')
plt.fill_between(df.index, df['Upper'], df['Lower'], alpha=0.1)
plt.title('Bollinger Bands')
plt.xlabel('Date')
plt.ylabel('Value')
plt.legend()
plt.grid(True)
plt.show()
まとめ
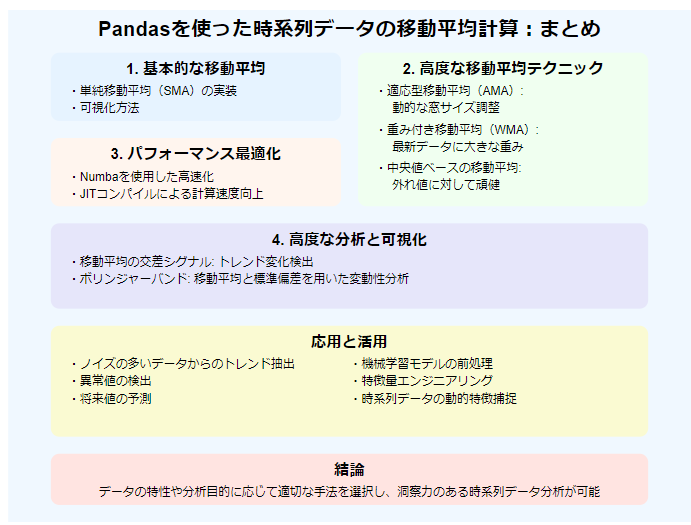
この記事では、Pandasを使用した時系列データの移動平均計算について、基本的な実装から高度なテクニックまで幅広く解説しました。以下に主要なポイントをまとめます:
-
基本的な移動平均: 単純移動平均(SMA)の実装と可視化方法を学びました。
-
高度な移動平均テクニック:
- 適応型移動平均(AMA): 市場の変動性に応じて窓サイズを動的に調整する手法を実装しました。
- 重み付き移動平均(WMA): 最新のデータにより大きな重みを付ける手法を紹介しました。
- 中央値ベースの移動平均: 外れ値に対してより頑健な手法を実装しました。
-
パフォーマンス最適化:
- Numbaを使用した高速化: JITコンパイルによる計算速度の向上方法を学びました。
-
高度な分析と可視化:
- 移動平均の交差シグナル: トレンド変化を検出する手法を実装しました。
- ボリンジャーバンド: 移動平均と標準偏差を用いた変動性の分析方法を学びました。
これらの技術を組み合わせることで、より洞察力のある時系列データ分析が可能になります。実際のデータセットに適用する際は、データの特性や分析の目的に応じて、適切な手法を選択することが重要です。
移動平均は、その簡潔さと強力な分析能力から、多くの分野で広く使用されています。この記事で学んだテクニックを応用することで、ノイズの多いデータからトレンドを抽出したり、異常値を検出したり、将来の値を予測したりすることができます。
さらに、これらの手法は機械学習モデルの前処理や特徴量エンジニアリングにも活用できます。例えば、適応型移動平均を使用して、時系列データの動的な特徴を捉えることができます。
今後の学習方向
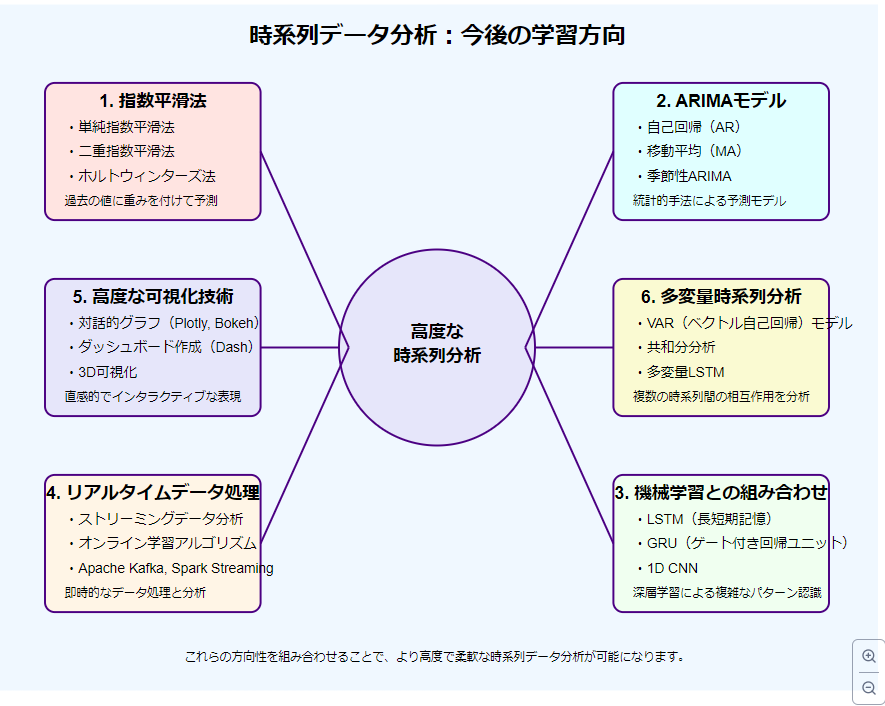
この記事の内容を十分に理解したら、以下のトピックに挑戦してみることをお勧めします:
-
指数平滑法: 単純移動平均の発展形として、過去のデータに対して指数関数的に重みを減少させる手法です。
-
ARIMA(自己回帰和分移動平均)モデル: 時系列データの予測に広く使用される統計モデルです。
-
機械学習との組み合わせ: 移動平均を特徴量として使用し、機械学習モデル(例:LSTM)と組み合わせる方法を探索してみましょう。
-
リアルタイムデータ処理: ストリーミングデータに対する移動平均の計算方法を学びます。
-
可視化の高度化: より対話的で情報量の多い可視化技術(例:Plotly、Bokeh)を学習します。
時系列データ分析は奥が深く、常に新しい手法や技術が登場しています。継続的な学習と実践を通じて、あなたのデータサイエンススキルをさらに向上させていってください。
参考資料
この記事が、皆さんの時系列データ分析スキルの向上に役立つことを願っています。


