KuMA Advent Calendar 2023 の 22日目の記事です.
Unity ML-Agentsで学習すると自動でログファイルが作成され,TensorBoardで確認することができます.
こんな感じのコマンドでTensorBoardを呼び出します.

表示されるグラフはこんな感じ.

軸のラベルがなかったり,1000が1e+3となっていたりして,レポートや論文でこの画像をそのまま貼るだけだと少しださいので,ログファイルを自分で読んでグラフを作ってみます.
ログは.tfeventsのファイルにバイナリデータとして保存されています.

これを読むにはTensorFlowをインストールする必要があります.ここでは一番簡単そうなGoogle Colaboratoryを使うことにします.Colab上で読めるように,以下のようなコードを作成しました.
import tensorflow as tf
import pandas as pd
import matplotlib.pyplot as plt

# TensorFlow 2.xのEager Executionを有効化(Colabではデフォルトで有効)
tf.compat.v1.enable_eager_execution()

# TensorBoard ログファイルのパス
log_file_path = '/content/events.out.tfevents.1686475046.DESKTOP-SOFV0RV.2812.0'
# 出力CSVファイルのパス
output_csv_path = '/content/output_data.csv'

# タグ
tags_of_interest = [
    'Environment/Cumulative Reward',
    'Environment/Episode Length',
    'Losses/Policy Loss',
    'Losses/Value Loss'
]

# データを格納するための辞書
data = {tag: [] for tag in tags_of_interest}

# TFRecordDatasetを使用してログファイルを読み込む
for raw_record in tf.data.TFRecordDataset(log_file_path):
    event = tf.compat.v1.Event.FromString(raw_record.numpy())
    for v in event.summary.value:
        if v.tag in tags_of_interest:
            data[v.tag].append({'Step': event.step, 'Value': v.simple_value})

# タグごとにデータフレームに変換し、CSVに保存
for tag, values in data.items():
    df = pd.DataFrame(values)
    df.to_csv(f'/content/{tag.replace("/", "_")}.csv', index=False)

    # グラフをプロット
    plt.figure(figsize=(10, 5))
    plt.plot(df['Step'], df['Value'], marker='o', label=tag)
    plt.title(f'{tag} Over Training Steps')
    plt.xlabel('Training Step')
    plt.ylabel(tag)
    plt.legend()
    plt.grid(True)
    plt.show()
ログファイルのパスの部分を自分のファイル名に合わせて変更してください.
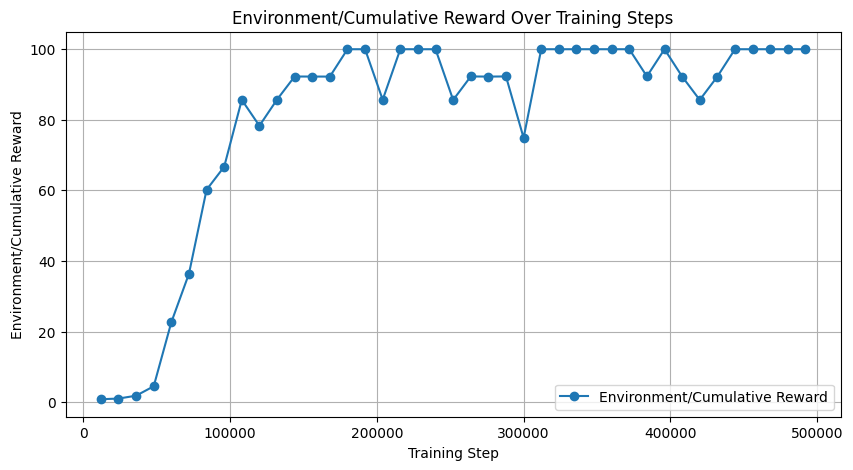
先ほどの.tfeventsをcolab上の「ファイル」にアップロードして実行すると,無事,読み込んだデータから以下のようなグラフを作成できました.

もう少し細かい周期で値を記録してもよかったかもしれません(.yamlファイルのsummary_freq: 12000の部分で指定する値).
あとは,お好みに合わせて調整ください.
ここまで読んでいただきありがとうございました.


