実行環境
- Mac OS Catanalina
- バージョン 10.15.6
- 言語 : Python
- Spyder
きっかけ
グラフとPythonを使って身近なものに触れたかった。
実際にやってみる
数学Ⅱ・数学B 大1問〔1〕(1)問題A
問題
関数 y = sin θ+√3 cos(θ) (0 <= θ <= π/2)の最大値を求めよ。
matplotlibの基本的なグラフ設定を列挙〜散布図と連続曲線〜
を参考にして、考えます。ここでは、問題通りに考えるのではなく、微分を利用してグラフにして考えようと思います。
sin x+√{3}*cos(x)を微分すると......
```Python
import sympy
x = sympy.Symbol('x')
print(sympy.diff(sympy.sin(x)+sympy.sqrt(3)*sympy.cos(x)))
本当はθなのですが、ここでは、次にグラフにしたいため、xにしています。
出力結果
-sqrt(3)*sin(x) + cos(x)
数学らしく書くと、
-√{3} *sin(x)+cos(x)
import matplotlib.pyplot as plt
import numpy as np


x = np.linspace(0, 90, 900)
y = -np.sqrt(3)*np.sin(x)+np.cos(x)

# グラフの大きさ指定
plt.figure(figsize=(5, 5))

# グラフの描写
plt.plot(x, y, '-', label='-√3 sin(θ)+cos(θ)')
# plt.plot(x, y, label='first', linestyle='-') # でも同じ

plt.title('Answer') # タイトル
plt.xlabel('x') # x軸のラベル
plt.ylabel('tilt') # y軸のラベル

plt.grid(True) # gridの表示
plt.legend()
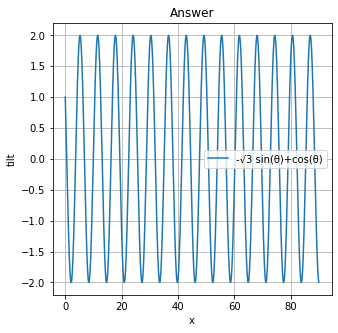
上のプログラムを実行すると、こんな感じになるはずです。明らかに極地が多いですね。では、元の問題のグラフを書きましょう(方向転換)。

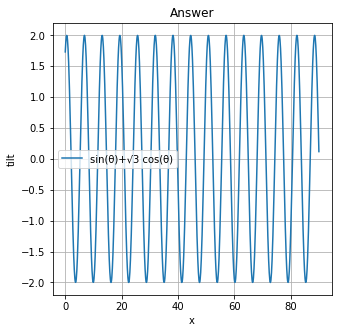
下のプログラムを実行した結果です。
import matplotlib.pyplot as plt
import numpy as np


x = np.linspace(0, 90, 900)
y = np.sqrt(3)*np.cos(x)+np.sin(x)

# グラフの大きさ指定
plt.figure(figsize=(5, 5))

# グラフの描写
plt.plot(x, y, '-', label='sin(θ)+√3 cos(θ)')
# plt.plot(x, y, label='first', linestyle='-') # でも同じ

plt.title('Answer') # タイトル
plt.xlabel('x') # x軸のラベル
plt.ylabel('tilt') # y軸のラベル

plt.grid(True) # gridの表示
plt.legend()
答えは見た目で2という感じがします。(実際、答えもそうです。)少し最後が感覚的(曖昧)になってしまいましたが、答えをグラフ・Pythonで得られました。
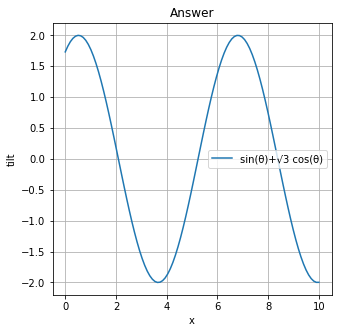
拡大版
こんな感じです。
**プログラム**

```Python
import matplotlib.pyplot as plt
import numpy as np


x = np.linspace(0, 10, 100)
y = np.sqrt(3)*np.cos(x)+np.sin(x)

# グラフの大きさ指定
plt.figure(figsize=(5, 5))

# グラフの描写
plt.plot(x, y, '-', label='sin(θ)+√3 cos(θ)')
# plt.plot(x, y, label='first', linestyle='-') # でも同じ

plt.title('Answer') # タイトル
plt.xlabel('x') # x軸のラベル
plt.ylabel('tilt') # y軸のラベル

plt.grid(True) # gridの表示
plt.legend()

