1
4

Delete article

Deleted articles cannot be recovered.

Draft of this article would be also deleted.

Are you sure you want to delete this article?

More than 3 years have passed since last update.

Seabornでグラフを描画したときにxlabelにすべての要素が入ってしまうときに確認すること

Posted at

はじめに

データ分析でEDAをするとMatplotlibやSeabornは欠かせないです。
可視化をするときには必須のライブラリですが、思い通りにいかないことが多々あります。

今回は、箱ひげ図やSwarmなどのグラフを描画したときにxlabelが変になっていたので、その解決方法について説明します。

問題

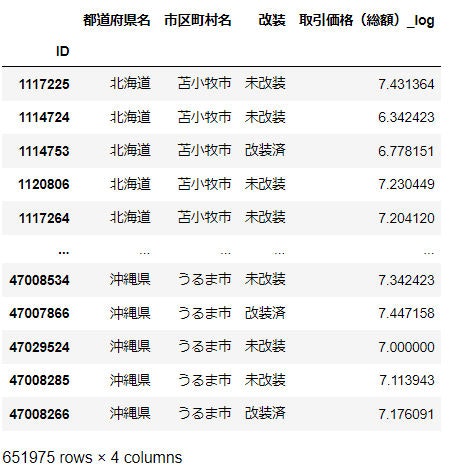
以下のデータフレームがあります。

bandicam 2021-06-04 21-33-02-076.jpg

このデータフレームの都道府県が北海道の行をすべて抽出して、x=都道府県名、y=取引価格(総額)_log、hue=改装の項目(改装済、未改装)に対して行います。

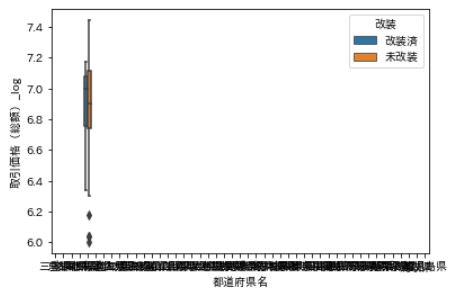
箱ひげ図やswarmplotなどで描画をすると以下のようになります。

boxplot.py
# 抽出
df = df[df["都道府県名"]=="北海道"]

# 箱ひげ図
import seaborn as sns
sns.boxplot(x='都道府県名', y='取引価格(総額)_log', hue="改装", data=df[:100])
plt.show()

bandicam 2021-06-04 21-34-09-732.jpg

swarmplot.py
# 抽出
df = df[df["都道府県名"]=="北海道"]

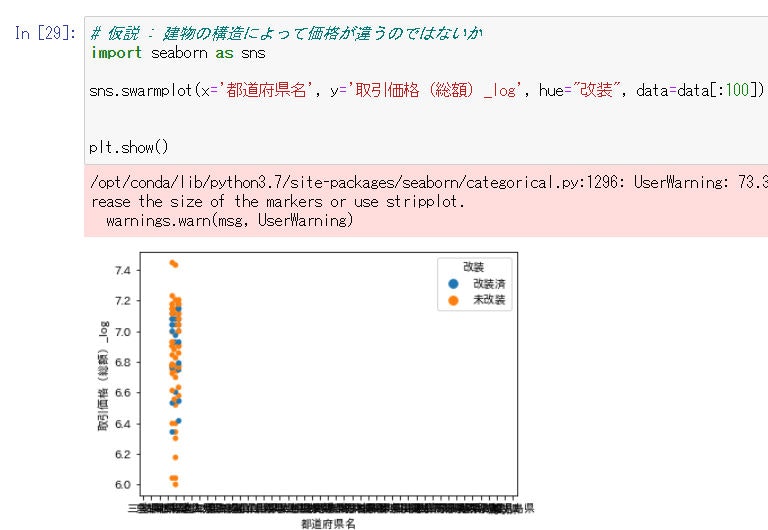
# swarmplot
import seaborn as sns
sns.boxplot(x='都道府県名', y='取引価格(総額)_log', hue="改装", data=df[:100])
plt.show()

bandicam 2021-06-04 17-10-53-283.jpg

データ数が多いため100行だけ可視化しています。

するとxlabelが北海道のはずだけのはずが、全都道府県表示されていました。

解決方法

原因は都道府県名のカラム型がcategory型であることでした。

LightGBMの前処理の最後にカテゴリ型にしていました。

bandicam 2021-06-04 21-14-50-770.jpg

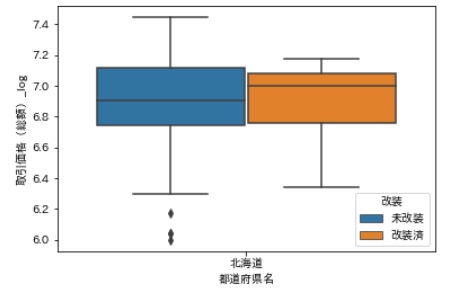
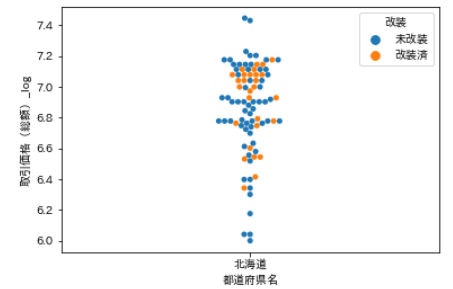
ですので、この処理をなくしてobject形にするとうまく表示されます。

bandicam 2021-06-04 21-41-39-545.jpg

bandicam 2021-06-04 21-42-07-121.jpg

おわりに

まさかのところに原因が潜んでいました。
同じところで悩まされる人が早くこの記事で解決できることを願っています。
参考記事

Pandasのgroupbyがうまく機能していないので教えていただきたいです。

1
4
0

Register as a new user and use Qiita more conveniently

  1. You get articles that match your needs
  2. You can efficiently read back useful information
  3. You can use dark theme
What you can do with signing up
1
4

Delete article

Deleted articles cannot be recovered.

Draft of this article would be also deleted.

Are you sure you want to delete this article?