概要
Von Voyage !
ハニーポットは初心者です。
I am a beginner honeypotter on GCP.
セキュリティをやっている人間としてハニーポットは興味があったので、WowHoneypotをGCPで建ててみました。
I usually work as security sales engineer, I have been interested in honeypot, so this time I built a WOWhoneypot on GCP.
資料 / Document
Wowhoneypotについては、以下の書籍で解説されています。超おススメな本です!
You can see about WOWhoneypot below . I strongly recommend this book !
https://www.amazon.co.jp/dp/B07GJ5R2QM/ref=dp-kindle-redirect?_encoding=UTF8&btkr=1
取れ高(国別) / Results per nations
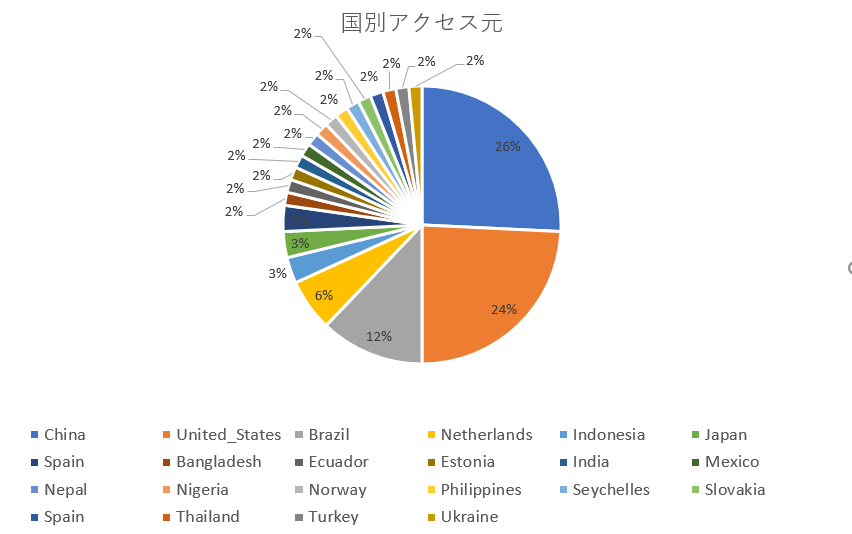
5日くらい建てていて、取れ高としてはこんな感じでした。トータルで66アクセス。多いのか少ないのか。。。
Results is below in 5 days. Total 66 access.
しかし、実際にアクセスがあると、世の中の風を感じるようでちょっと面白いです。CNとUSの2トップですね。
US and China is the most !
なお今回試したのはTWリージョンに建てたVMを使っています。1日数十円くらい。。。この程度のコストでこれだけできるのは素晴らしいですね。
This time , I build a VM on Taiwan region. and it costs a dozn of yen per a day.
I think this is great that we can do that with such a small cost !
仕組み / system
Infrastracture:Google Cloud Platform(GCP) / Google Compute Engine(GCE) / Debian OS
Honeypot:WowHoneypot
API to get geolocation info:ipstack ( https://ipstack.com/ )
Infrastracture:Google Cloud Platform(GCP)
GCP上にLinuxのVMを建てて、そこにWohHoneypotをインストールします。
I build a Linux VM on GCP, and installed WOWHoneypot on it.
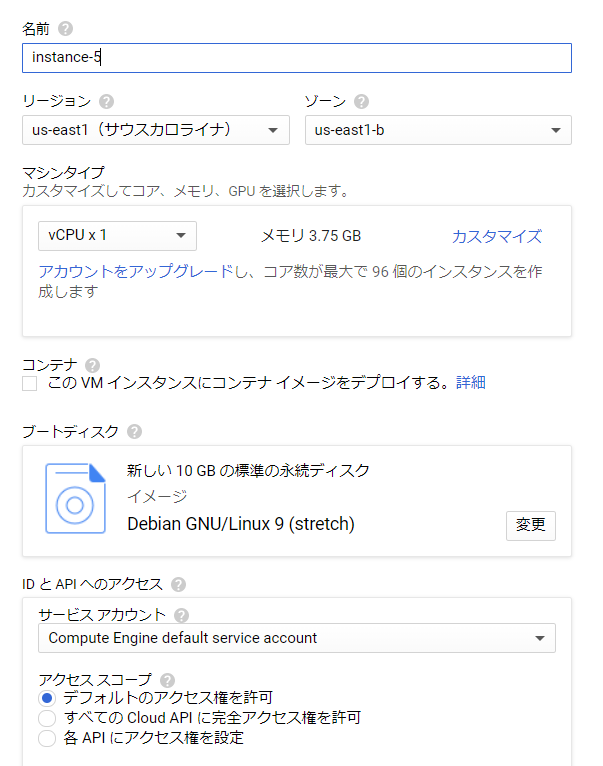
GCEで、リソースの指定はほぼデフォルトのままでVMを建てます。
When building a VM, almost all of settings are default settings.
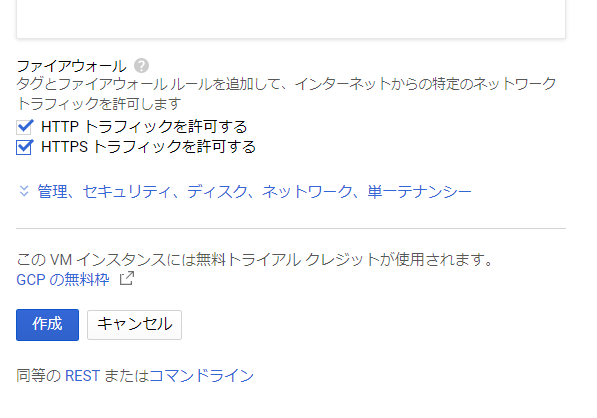
ファイアウォールの設定で、http/httpsは許可しておきました。
And allowed http/https connection on Firewall settings.
Honeypot:WowHoneypot
作ったLinux(Debian)にsshでアクセスし、上記の本の通りにHoneypotを設定します。
コマンドとしては、以下の通りです。
root ユーザで
apt update
apt upgrade
apt install ufw
apt install git
iptables -t nat -A PREROUTING -p tcp --dport 80 -j REDIRECT --to-port 8080
ufw default DENY
ufw allow 22/tcp
ufw allow 80/tcp
ufw allow 8080/tcp
ufw allow 443/tcp
ufw enable
$ 一般ユーザで
git clone https://github.com/morihisa/WOWHoneypot.git wowhoneypot
cd ./wowhoneypot
python3 ./wowhoneypot.py &
(今回はデフォルトの設定のままでWEBサーバを起動します。)
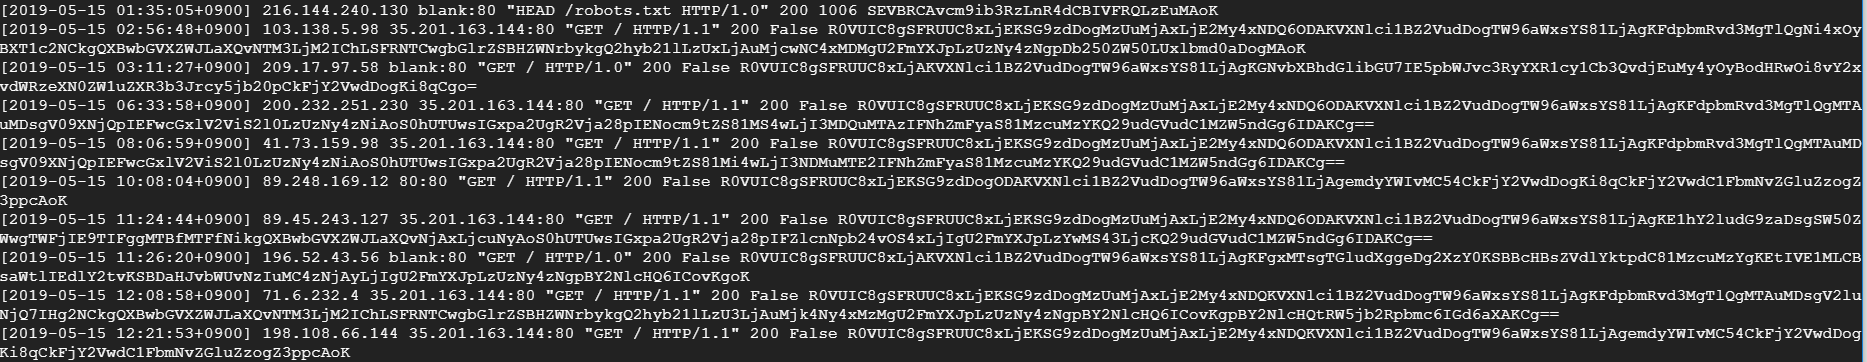
しばらくすると、access_logに色々とアクセスされていることがわかります。
ロケーション情報:ipstack ( https://ipstack.com/ )
IPアドレスは分かるんですが、それがどこなのか、を知りたいと思ったので、
上記サイトで無料サインアップし、IPアドレスからロケーション情報を取得するAPIを利用します。
APIを、ハニーポットで得られたIPアドレスを含めてcurlで叩くと以下のような結果が得られます。
curl http://api.ipstack.com/194.32.117.3?access_key=[APIキー]
{"ip":"194.32.117.3","type":"ipv4","continent_code":"EU","continent_name":"Europe","country_code":"EE","country_name":"Estonia","region_code":null,"region_name":null,"city":null,"zip":null,"l
atitude":59,"longitude":26,"location":{"geoname_id":null,"capital":"Tallinn","languages":[{"code":"et","name":"Estonian","native":"Eesti"}],"country_flag":"http://assets.ipstack.com/flags
/ee.svg","country_flag_emoji":"\ud83c\uddea\ud83c\uddea","country_flag_emoji_unicode":"U+1F1EA U+1F1EA","calling_code":"372","is_eu":true}}
それをシェルにしたのが以下のものです。
IPアドレスを元に、大陸名、国名、都市名、を表示したいと思います。
for ip in cat access_log | awk '{print $3 }'
do
curl -s http://api.ipstack.com/$ip?access_key=[ipstack登録時に取得したキー] |sed "s/ /_/g" |sed "s/,/ /g" | awk {'print $4,$6,$9'}
done
画像だと以下です。
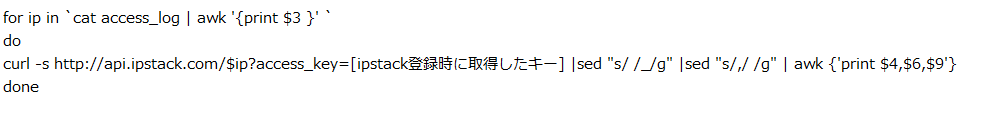
バッククォートで、cat から'{print $3 }' までを囲っています。
Qiita上ではそのままだと文字が灰色になるだけなので、画像でも貼っておきました。
で、上記シェルを実施すると以下のようになります。(一部抜粋)
"continent_name":"North_America" "country_name":"United_States" "city":null
"continent_name":"Europe" "country_name":"Ukraine" "city":"Dnipro"
"continent_name":"North_America" "country_name":"United_States" "city":"Brea"
"continent_name":"Asia" "country_name":"Bangladesh" "city":null
"continent_name":"South_America" "country_name":"Brazil" "city":"Palhoca"
"continent_name":"South_America" "country_name":"Brazil" "city":"Ariquemes"
"continent_name":"Asia" "country_name":"Indonesia" "city":"Cilangkap"
"continent_name":"North_America" "country_name":"United_States" "city":"San_Diego"
"continent_name":"Europe" "country_name":"Estonia" "city":null
"continent_name":"Europe" "country_name":"Netherlands" "city":"Amsterdam"
"continent_name":"South_America" "country_name":"Ecuador" "city":"Guayaquil"
"continent_name":"North_America" "country_name":"United_States" "city":"San_Diego"
"continent_name":"Asia" "country_name":"Nepal" "city":null
"continent_name":"Europe" "country_name":"Norway" "city":null
"continent_name":"Africa" "country_name":"Seychelles" "city":"Anse_aux_Pins"
"continent_name":"South_America" "country_name":"Brazil" "city":"Assis"
"continent_name":"Europe" "country_name":"Spain" "city":"Polinya_de_Xuquer"
"continent_name":"North_America" "country_name":"Mexico" "city":"Mexico_City"
"continent_name":"Asia" "country_name":"Japan" "city":"Heiwajima"
"continent_name":"North_America" "country_name":"United_States" "city":"Los_Angeles"
"continent_name":"South_America" "country_name":"Brazil" "city":"Santa_Ines"
"continent_name":"Asia" "country_name":"Japan" "city":"Tokyo"
"continent_name":"Asia" "country_name":"China" "city":"Hangzhou"
"continent_name":"Asia" "country_name":"China" "city":"Guiyang"
上記結果を国別に表計算ソフトでまとめたのが、冒頭に挙げたグラフです。(以下再掲)
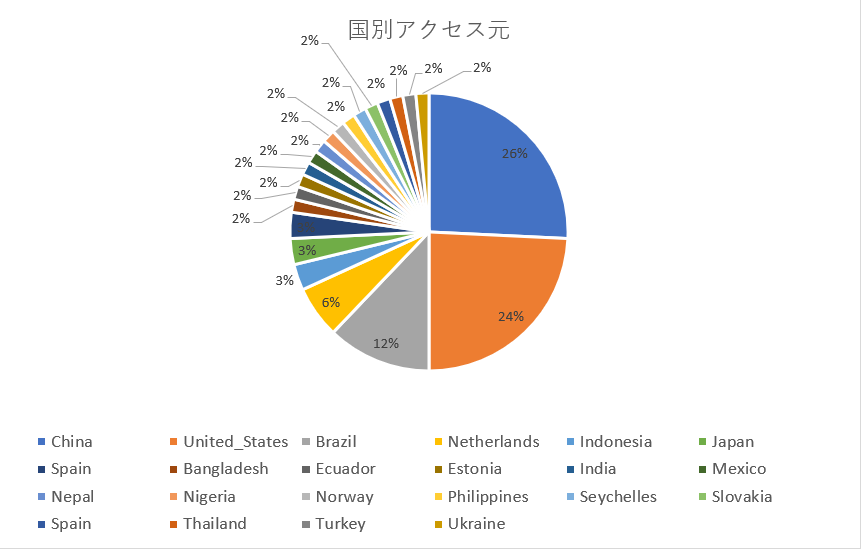
改めて見ると、結構いろんな国からアクセスしてきていますね。
日本からのは平和島からだったりしていますね。あと、ネパールとかからも来てますね。
とりあえず今回はこんなところで。ではまた。