概要
AWS IoTで出るログを例に、Logs Insightsの基本的で便利なコマンドを紹介します。
より応用的なことは、CloudWatch Logs Insights のクエリ構文 - Amazon CloudWatch Logsのページを見ながら作ると良いです。
今回仮定するデータ
検索対象のCloudWatchLogsには以下のJson形式のデータが入るとします。
Logs Insightsはjsonであれば勝手にパースしてくれ、logLevelやaccountIdなどと入力すれば、普通に使えるようになります。
オリジナルのデータなどはparseコマンドでパースします。本記事では触れません。
(参考: CloudWatch Logs Insights のクエリ構文 - Amazon CloudWatch Logs)
{
    "timestamp": "2021-11-16 04:03:46.596",
    "logLevel": "INFO",
    "accountId": "accountId",
    "status": "Success",
    "eventType": "RuleExecution",
    "clientId": "testclient",
    "topicName": "topic",
}
特定のフィールドのみを表示する
display @timestamp, eventType, topicName, clientId
特定のフィールドの数を表示する
stats count(*) by topicName
ちなみに2つのフィールドでのコンボも可能
stats count(*) by eventType, topicName
フィールドに特定の文字列が入っているものを検索対象から外す。
eventTypeにRuleが入っているものを排除
""を使うと、部分文字列一致を確認します。
\\を使うと正規表現が使えます(CloudWatch Logs Insights のクエリ構文 - Amazon CloudWatch Logs)
filter eventType not like "Rule"
すでに出たcountとコンボで使います。
filter eventType not like "Rule"
| stats count(*) by eventType, topicName, clientId
さらにcountでソートしたい場合
filter eventType not like "Rule"
| stats count(*) as count by eventType, topicName, clientId
| sort count desc
検索結果を可視化する
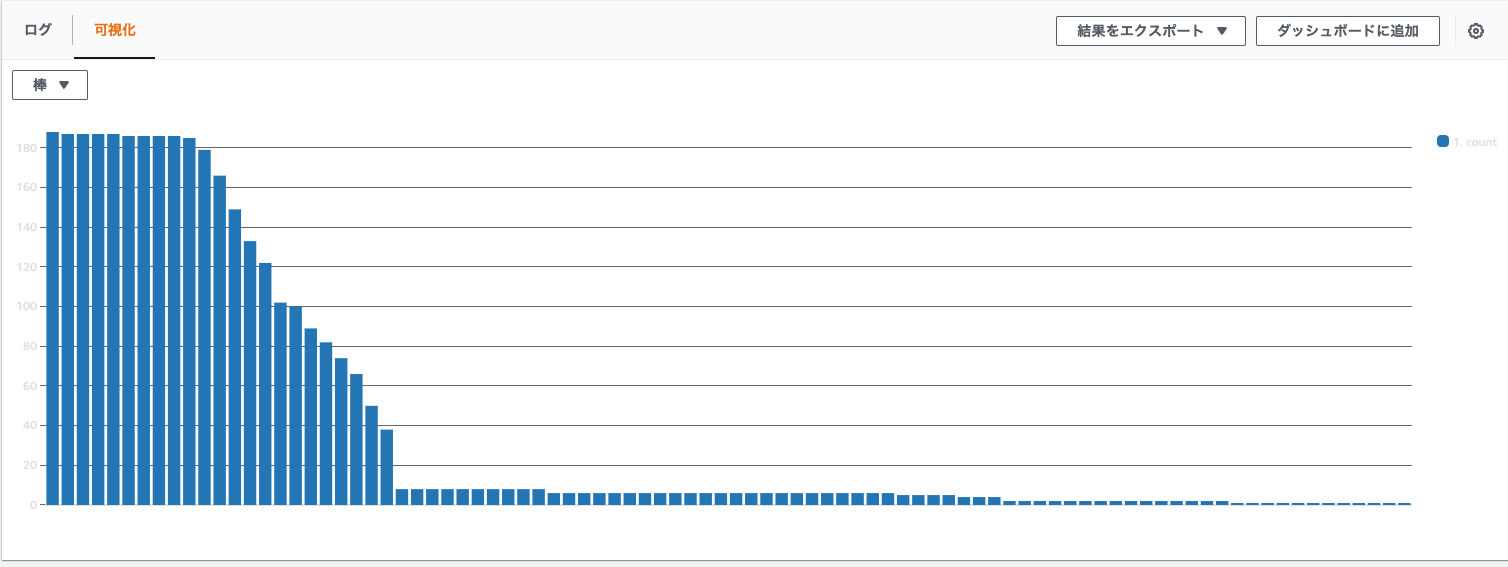
「可視化」というタブをクリックするとグラフで結果を見ることができます。
この時、sortしてあげるとグラフも綺麗になります。
filter @message not like "Rule"
| stats count(*) as count by eventType, topicName, clientId
| sort count desc    #ここでソートしてあげる
| limit 90
ソートなしの円グラフ

ソートありの円グラフ

ソートなしの棒グラフ

ソートありの棒グラフ

まとめ
insightsは便利なのでジャンジャン使いましょう!