[以下追記] matplotlib のバージョンが3.7.0等だと、aplpy でエラーが起きるようです。
TypeError: WCSAxes.__init__() got multiple values for argument 'wcs'
pip install matplotlib==3.5.2
などとしてダウングレードしてください。
[以上追記]
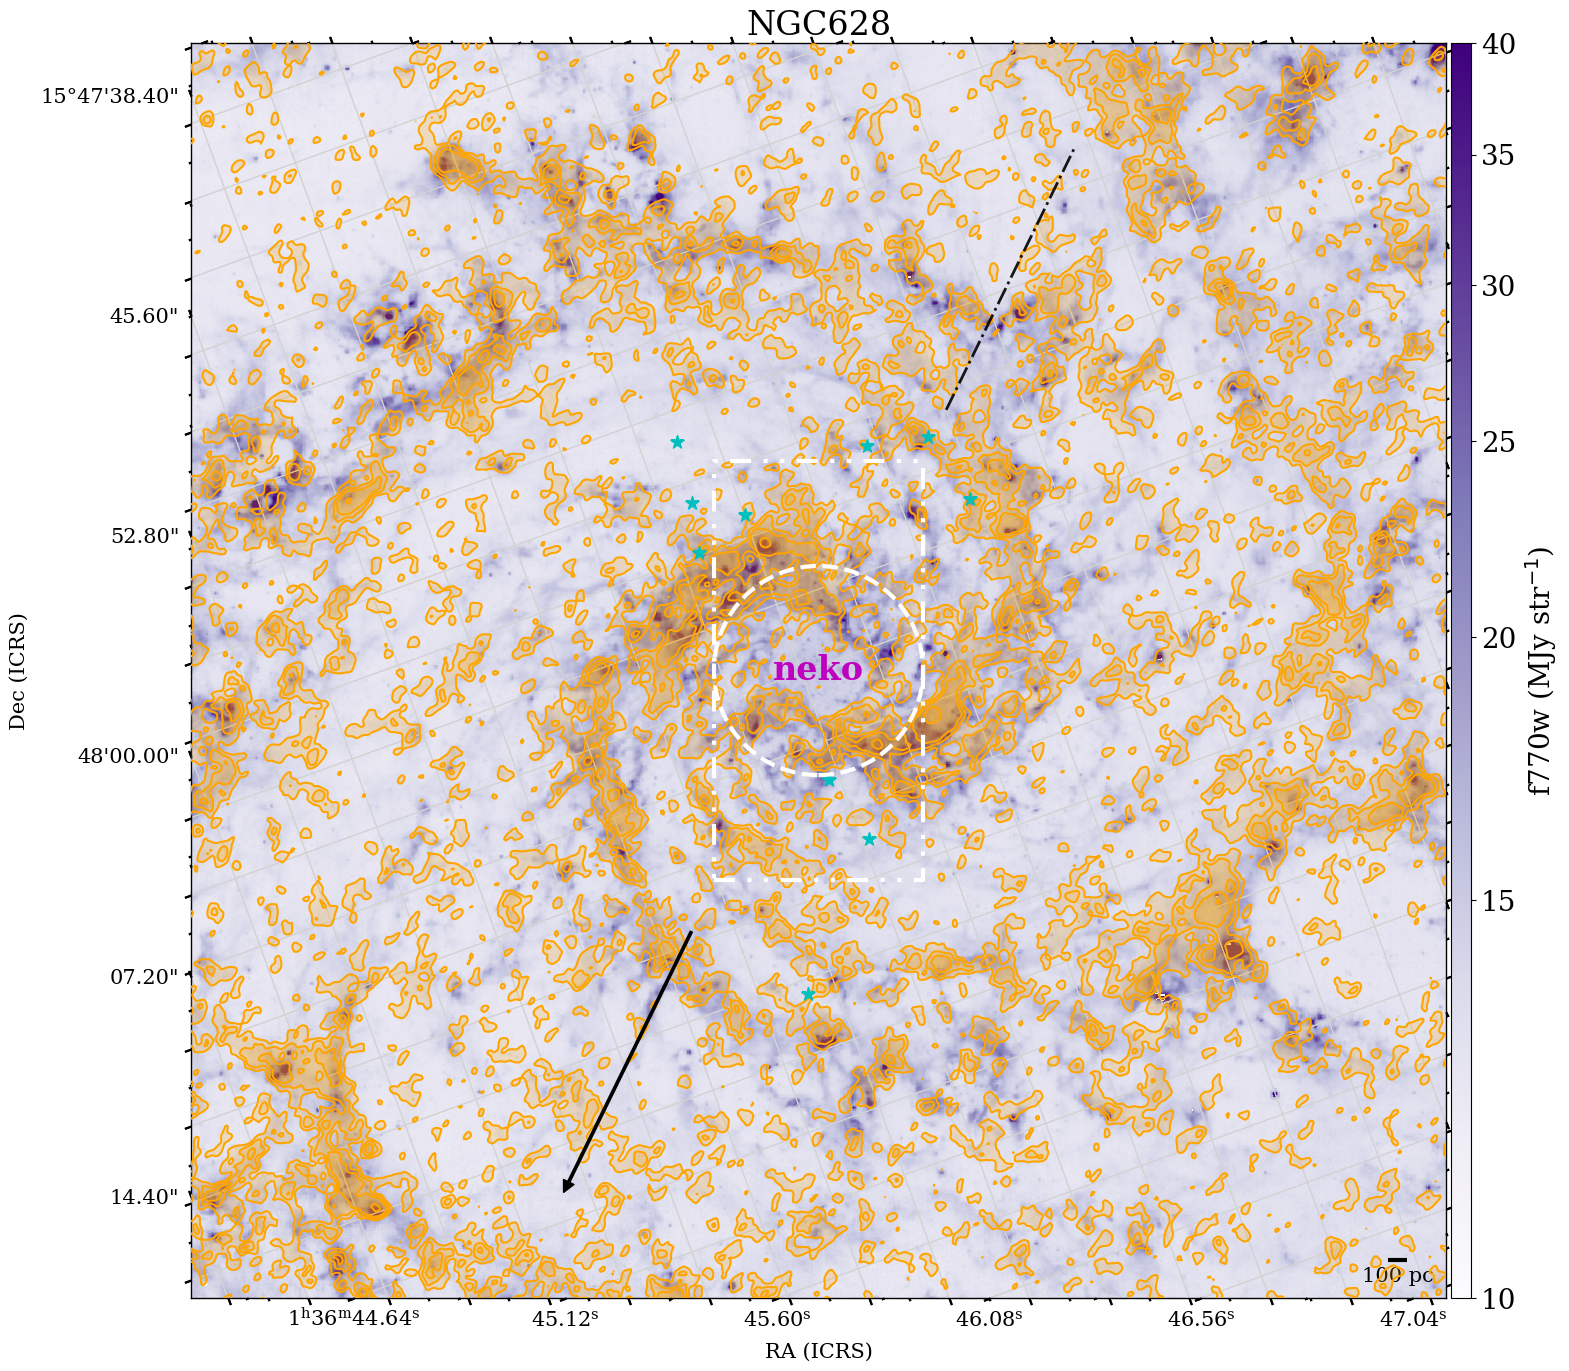
この記事では、(備忘録として、) aplpy を用いて画像の作る際の設定について記述します(随時更新する可能性あり)。
今回は例として、NGC628 の、JWST と ALMA (PHANGS) の公開データを使用します。
このサイトから JWST の中間赤外線のデータ (jw02107-o039_t018_miri_f770w_i2d.fits) をダウンロードします。
また、このサイトのリンクから ALMA のCO のデータ (ngc0628_12m+7m+tp_co21.fits) をダウンロードします。
まずは必要なものを import します。
from astropy.io import fits
from astropy.wcs import WCS
import astropy.units as u
from astropy.coordinates import SkyCoord
from astropy.coordinates import ICRS, Galactic, FK4, FK5
import matplotlib.pyplot as plt #v3.5.2
import numpy as np
import aplpy #v2.0.3
CO の積分強度の hdu を作るための関数を適当に定義します。
def make_integ_hdu(hdu):
    data = hdu.data
    header = hdu.header
    new_data = np.nansum(data[:], axis=0)*np.abs(header["CDELT3"]/1000.0)
    header = del_header_key(header, ["CRVAL3", "CRPIX3", "CRVAL3", "CDELT3", "CUNIT3", "CTYPE3", "CROTA3", "NAXIS3", "PC1_3", "PC2_3", "PC3_3", "PC3_1", "PC3_2"])
    header["NAXIS"] = 2
    new_hdu = fits.PrimaryHDU(new_data, header)
    return new_hdu
def del_header_key(header, keys): # headerのkeyを消す
    import copy
    h = copy.deepcopy(header)
    for k in keys:
        try:
            del h[k]
        except:
            pass
    return h
必要なパラメータを適当に定義します。
map_center = SkyCoord("1:36:41.7863 +15:47:00.801", frame=FK5, unit=(u.hourangle, u.deg))
random_star_ra = map_center.ra.degree + (np.random.random(10)-0.5)*60.0/3600.0
random_star_dec = map_center.dec.degree + (np.random.random(10)-0.5)*60.0/3600.0
integ_hdu = make_integ_hdu(fits.open("./ngc0628_12m+7m+tp_co21.fits")[0])
hdu_color = fits.open("jw02107-o039_t018_miri_f770w_i2d.fits")[1]
以下が aplpy の設定ほぼ全部盛りです。適宜変更してご使用ください。
plt.rcParams['xtick.direction'] = 'out' # inで内側
plt.rcParams['ytick.direction'] = 'out'

#fig, ax = plt.subplots(figsize=(16, 16))
fig = plt.figure(figsize=(16, 16))
f = aplpy.FITSFigure(hdu_color, slices=[0], convention='wells', figure=fig, subplot=[0.1, 0.1, 0.8, 0.8])
f.show_colorscale(vmin=10, vmax=40, stretch='log', cmap="Purples", aspect="equal")

f.recenter(map_center.ra.degree, map_center.dec.degree, width=120.0/3600.0, height=120.0/3600.0)

f.ticks.set_xspacing(0.002)  # degree
f.ticks.set_yspacing(0.002)
f.ticks.set_length(5, minor_factor=0.5)  # points
f.ticks.set_color('k')
f.ticks.set_linewidth(1.5)  # points
f.ticks.set_minor_frequency(2)
f.tick_labels.set_xformat('hh:mm:ss.ss') # FK5
f.tick_labels.set_yformat('dd:mm:ss.ss')
#f.tick_labels.set_xformat('dd.d') # GAL
#f.tick_labels.set_yformat('dd.d')
f.tick_labels.set_font(size=15, family='serif')
f.axis_labels.set_font(size=15, family='serif')

f.add_scalebar(np.rad2deg(np.arcsin(100.0/11e6))) # 距離 11e6 pc で 100 pc の bar
f.scalebar.set_label('100 pc')
f.scalebar.set_font_family('serif')
f.scalebar.set_font_size(15)
f.scalebar.set_color("k")
f.scalebar.set_linewidth(3)
#f.scalebar.set_corner("bottom right")

f.add_colorbar()
f.colorbar.set_axis_label_text(r"f770w (MJy str$^{-1}$)")
f.colorbar.set_axis_label_font(size=20, family='serif')
#f.colorbar.set_ticks([0,1,2,3,4,5])
f.colorbar.set_font(size=20, family='serif')
f.colorbar.set_location("right")


f.add_beam(major=0.3*u.arcsec, minor=0.3*u.arcsec, angle=0.0*u.degree) # header に書いてあれば引数の記述は必要なし
f.beam.set_color('white')
f.beam.set_hatch('+')


f.add_grid()
f.grid.set_color('lightgray')
f.grid.set_alpha(1)

levels = [5, 10, 16, 32]
f.show_contour(integ_hdu, levels=levels, linewidths=1.5, colors="orange", zorder=100) # もしくはファイル名

for l in levels: # 半透明コントア。999999 はとりあえず大きな数。
        f.show_contour(integ_hdu, levels=[l, 999999], convention='wells', colors="orange", slices=[0], filled=True, alpha=0.2, zorder=101)


f.show_markers(random_star_ra, random_star_dec, marker="*", c="c", s=100, zorder=102)


f.show_circles(map_center.ra.degree, map_center.dec.degree, 10.0/3600.0, color="w", linestyle="--", linewidth=3, zorder=103)
f.show_rectangles(map_center.ra.degree, map_center.dec.degree, 20.0/3600.0, 40.0/3600.0, angle=0.0, color="w", linestyle=(0, (5, 3, 1, 3, 1, 3)), linewidth=3, zorder=103)


f.add_label(map_center.ra.degree, map_center.dec.degree, "neko", weight="bold", color="m", family="serif", size=24, zorder=104)

x_start, y_start, x_length, y_length = map_center.ra.degree + 20.0/3600.0, map_center.dec.degree + 20.0/3600.0,  20.0/3600.0,  20.0/3600.0
f.show_arrows(x_start, y_start, x_length, y_length, color="k", width=2, head_width=10, head_length=10, zorder=105)

f.show_lines([np.array([[map_center.ra.degree - 20.0/3600.0, map_center.ra.degree - 40.0/3600.0], [map_center.dec.degree - 20.0/3600.0, map_center.dec.degree - 40.0/3600.0]])], color='k', linewidth=2, alpha=0.9, linestyle="-.", zorder=106)

f.set_nan_color("lightgray")

f.set_title("NGC628", color="k", family="serif", size=24, y=1.00)

plt.tight_layout()

plt.rcParams['figure.facecolor'] = "w"# 背景を白にしたい時
plt.rcParams['figure.edgecolor'] = "w"

plt.show()

f.save("qiita_aplpy_all.png", dpi=100) # pdf や eps でも出力可能。ただし、eps はそのままではTeXに張り付けられず、また、半透明部分がバグる。
以上です。
リンク
目次
