本日は
- Julia のアドベントカレンダーネタです.私いっぱい投稿しましたが今回で最後です.

- 今回は JSXGraph という JavaScript ライブラリを Julia から呼び出す JSXGraph.jl の紹介と Jupyter Notebook で動かす方法について紹介します.JSXGraph.jl の作者は Franklin.jl のと同じ人ですね.と言うこともありサンプルページは静的ウェブサイトジェネレータの Franklin.jl で記述されています.
準備
JSXGraph.jl はまだ WIP ですけれど公式パッケージとして登録されています.
$ julia -e 'using Pkg; Pkg.add("JSXGraph")'
サンプル
- Atom/Juno または REPL で次のコードを貼り付けます.
using JSXGraph

brd = board("brd",xlim=[-15,15], ylim=[-15,15],axis=true)

a = slider("a", [[8, 7], [12, 7], [-3, 0.1, 10]])
b = slider("b", [[8, 6], [12, 6], [-1, 1, 5]])
c = slider("c", [[8, 5], [12, 5], [-10, -5, 2]])
[a,b,c] |> brd

@jsf f(x) = val(a) * x^2 + val(b) * x + val(c)

brd ++ plot(f)
brd.style="width:500px;height:500px;margin:0 auto;"
show(brd)
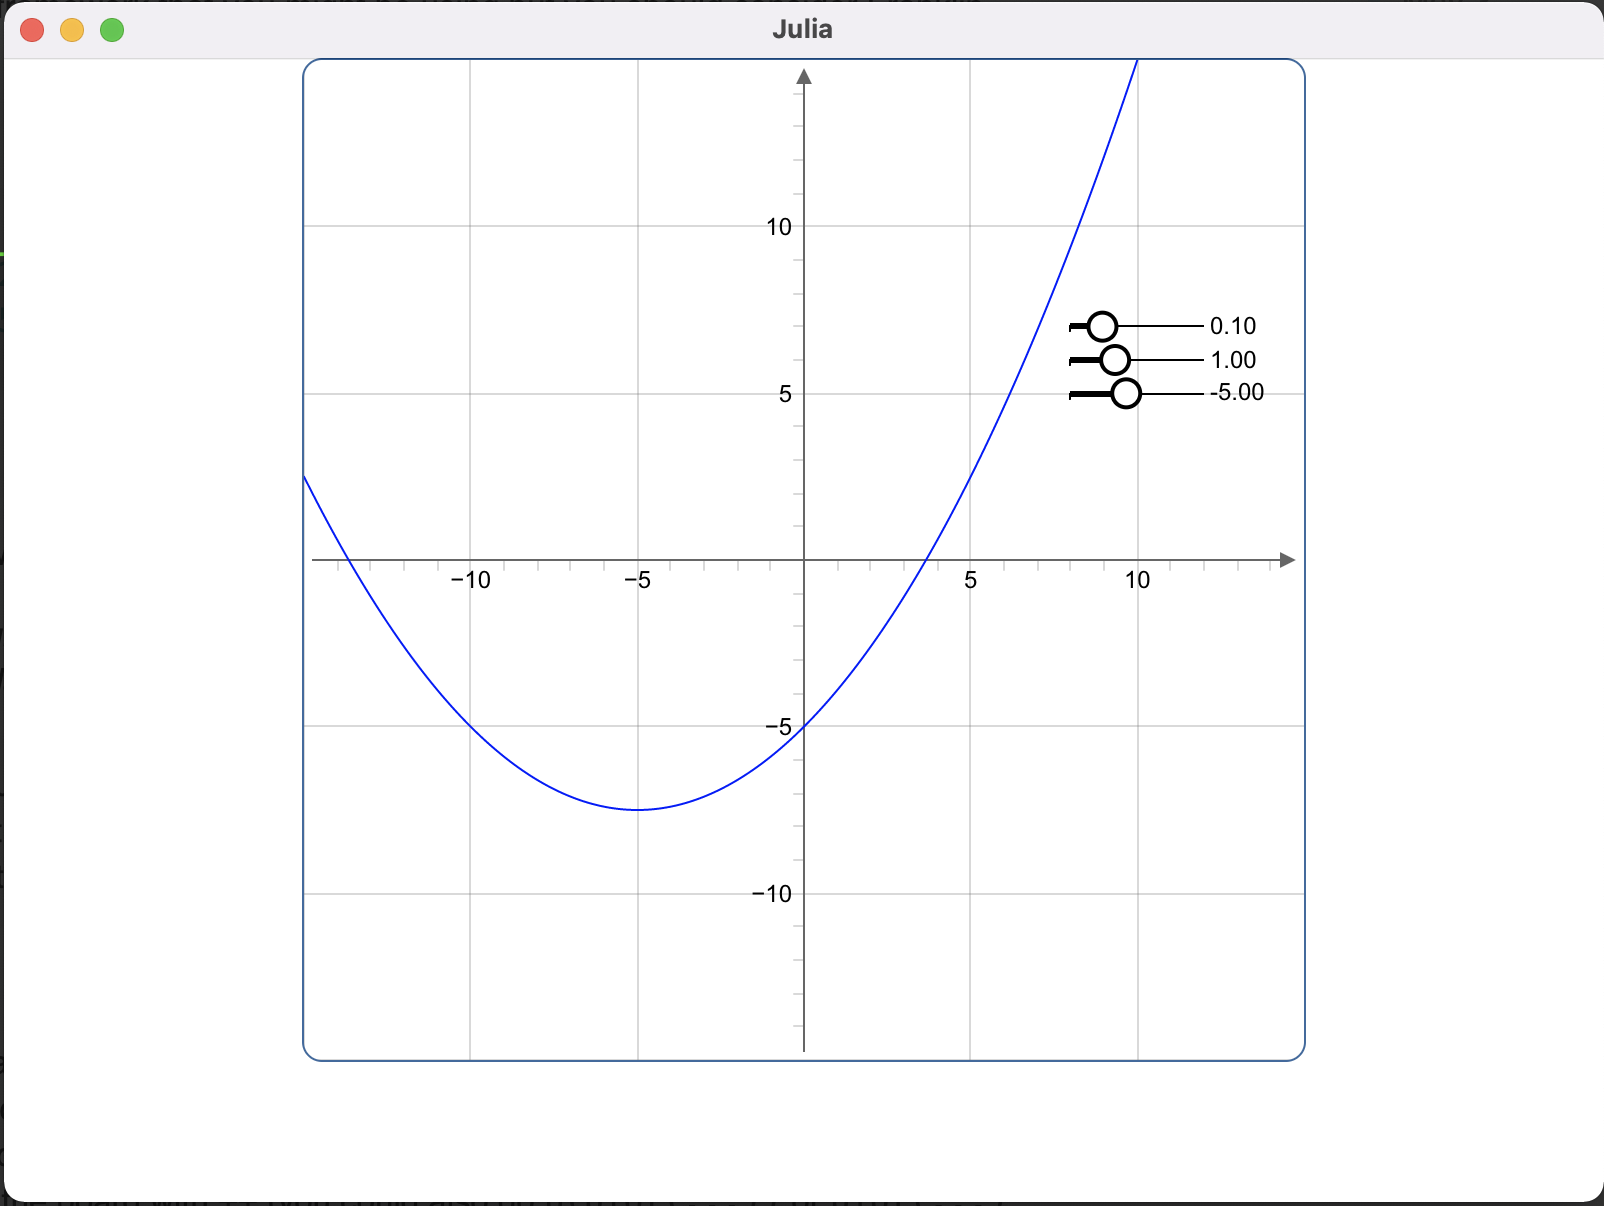
結果は下記のように 二次関数 のグラフにパラメータを変動できるスライダー三本が見えるようになります.
上記の Julia コードは大まかに次の index.html とほぼ同じようなものになります.
<!DOCTYPE html>
<html>

<head>
    <title>Type Script Greeter</title>
    <link rel="stylesheet" type="text/css" href="http://jsxgraph.uni-bayreuth.de/distrib/jsxgraph.css" />
    <script type="text/javascript" src="http://jsxgraph.uni-bayreuth.de/distrib/jsxgraphcore.js"></script>
    <script id="MathJax-script" async src="https://cdn.jsdelivr.net/npm/mathjax@3/es5/tex-mml-chtml.js"></script>
</head>

<body>
    <div id="board" class="jxgbox" style="width:500px; height:500px;"></div>
    <script type="text/javascript">
        JXG.Options.text.useMathJax = true;
        var board = JXG.JSXGraph.initBoard(
            "board",
            {
                boundingbox: [-15, 15, 15, -15],
                axis: true
            }
        );
        /* The slider needs the following input parameters:
        [[x1, y1], [x2, y2], [min, start, max]]
        [x1, y1]: first point of the ruler
        [x2, y2]: last point of the ruler
        min: minimum value of the slider
        start: initial value of the slider
        max: maximum value of the slider
        */
        var a = board.create("slider", [[8, 7], [12, 7], [-3, 0.1, 10]], { name: "a" });
        var b = board.create("slider", [[8, 6], [12, 6], [-1, 1, 5]], { name: "b" });
        var c = board.create("slider", [[8, 5], [12, 5], [-10, -5, 2]], { name: "c" });
        // y = ax^2+bx+c
        var func = board.create(
            "functiongraph",
            [
                function (x) {
                    return a.Value() * x * x + b.Value() * x + c.Value();
                }
            ]
        )
    </script>
</body>

</html>
julia の board オブジェクトに ++ や |> などでUIの部品を追加していく感じです.そうすると内部では対応するJSを吐き出すように準備されます.str 関数を使うと結果を見ることができます.
julia> str(brd)
... (出力は省略)
JSXGraph.standalone を使うと文字通り出力文字列を html ファイルとして出力します.
JSXGraph の display https://github.com/tlienart/JSXGraph.jl/blob/master/src/display.jl 関数を見ると上記の画像は Blink に HTML を流し込んでいることがわかります.
Jupyter Notebook で
まだ公式に IJulia 上で動作のサポートがされてないのですが WebIO.jl を使って表示する方法を見つけたので書いておきます.いずれにおいても下記のようなテンプレートを使います.
using JSExpr
using WebIO

n=Node(
    :div,
    id = "board",
    className = "jxgbox",
    attributes=Dict(
        :style=>"width:500px; height:500px;margin:0 auto;"
    )
)

w = Scope(
    imports=[
            "https://cdnjs.cloudflare.com/ajax/libs/jsxgraph/1.1.0/jsxgraphcore.js",
            "https://cdnjs.cloudflare.com/ajax/libs/jsxgraph/1.1.0/jsxgraph.css",
    ]
)(n)

onmount(
    w,
    # ここで JS のコードを書く
)
Node は WebIO が export する struct です ここでは div タグを作っています.HTML でいえば
<div id="board" class="jxgbox" style="width:500px; height:500px;"></div>
のようなことをしたいわけです.
Scope では JSXGrpah を使うためのJSライブラリとCSSを導入しています.
あとは onmount(w, ...) のようにして JS を書きます.たとえば次のように生のJSを挿入する方法
using JSExpr
js"""
    (function(){
        var board = JXG.JSXGraph.initBoard(
            "board",
            {
                boundingbox: [-15, 15, 15, -15],
                axis: true
            }
        );
        var board=JXG.JSXGraph.initBoard("board",{"axis":true,"boundingbox":[-15,15,15,-15]});
        var a = board.create("slider", [[7, 7], [11, 7], [-3, 0.1, 10]], { name: "a" });
        var b = board.create("slider", [[7, 6], [11, 6], [-1, 1, 5]], { name: "b" });
        var c = board.create("slider", [[7, 5], [11, 5], [-10, -5, 2]], { name: "c" });
        // y = ax^2+bx+c
        var func = board.create(
            "functiongraph",
            [
                function (x) {
                    return a.Value() * x * x + b.Value() * x + c.Value();
                }
            ]
        )
        var quadratic = board.create(
            'text',
            [
                2,
                10,
                function () {
                    return 'f(x) = ax^2+bx+c';
                }
            ],
            { fontSize: 20 }
        );
        return board;
    })
    """
があります.これだと芸がないので JSExpr.jl と言う Julia のコードを JS に変換するマクロを提供する Julia パッケージを使う方法があります.
@js function ()
        @var board = JXG.JSXGraph.initBoard(
            "board",
            Dict(
                :axis=>true,
                :boundingbox => [-15, 15, 15, -15],
            )
        );
        @var a = board.create("slider",
            [[7, 7], [11, 7], [-3, 0.1, 10]],
            Dict(:name => "a" )
        )
        @var b = board.create("slider", [[7, 6], [11, 6], [-1, 1, 5]], Dict(:name => "b" ))
        @var c = board.create("slider", [[7, 5], [11, 5], [-10, -5, 2]], Dict(:name => "c" ))
        @var func = board.create(
            "functiongraph",
            [
                (x) -> a.Value() * x * x + b.Value() * x + c.Value()
            ]
        )
        @var quadratic = board.create(
            "text",
            # I would like to render text using mathjax ...
            [ 2, 10, () -> "f(x) = ax^2+bx+c"],
            Dict(:fontSize=> 20)
        );
        return board # must be at the end of this function
    end
ドキュメントを見ると let マクロがあるようですが...現行の安定版では提供されてません. dev 版であります.ちょっと Web 系のメンテナンスが放置されてるようです.
Appendix
Genie.jl という Julia のウェブフレームワークで動かすこともできます.
JSXGraph.standalone 関数が HTML を返すのでルーティングの処理でそのHTMLを返せば OK 的な感じで実装できます.
主なロジックは
を見ていただければ.残りのほとんどは Genie.jl のアプリを作る雛形で全てできます.Heroku にデプロイもできたので 数学のホームページも作れるかもですね.
