本日は
先日の Bokeh をつかって行列演算を可視化する に引き続いて Bokeh の練習として回転行列
R(\theta)=\begin{bmatrix}
\cos\theta& -\sin\theta\\
\sin\theta& \cos\theta
\end{bmatrix}
のパラメータ $\theta$ を変えた時に像がどのように変化するのを見ていきましょう.
とはいえ,回転行列というぐらいですからぐるぐる回りますよね.
当たり前かもしれませんが,実際に実装して確かめて見ましょう.
実装例
ベタがきで書いています.
本当はクラス化した方が再利用性の観点から良いのですが,それは読者の演習問題とします.よくあるパターンですね.
"""
Reference:
https://github.com/bokeh/bokeh/blob/master/examples/plotting/server/animated.py
"""

import numpy as np
from bokeh.plotting import figure, output_file, show, curdoc
from bokeh.models import ColumnDataSource, Div
from bokeh.layouts import gridplot, column
from bokeh.client import push_session

init_degree = 30


def rot_mat(degree):
    theta = np.deg2rad(degree)
    mat = np.array([[np.cos(theta), -np.sin(theta)],
                    [np.sin(theta), np.cos(theta)]])
    return mat


def main():
    xs = np.linspace(-np.pi, np.pi, 11)
    ys = xs
    Xs, Ys = np.meshgrid(xs, ys)
    Xs, Ys = Xs.flatten(), Ys.flatten()

    mat = rot_mat(init_degree)

    transXs, transYs = mat @ np.array([Xs, Ys])

    output_file("lasso_selector.html")
    TOOLS = "pan,lasso_select,save,reset"
    source = ColumnDataSource(data=dict(Xs=Xs,
                                        Ys=Ys,
                                        transXs=transXs,
                                        transYs=transYs))

    f = figure(tools=TOOLS, title="target",
               x_range=(-np.pi*np.sqrt(2)-1, np.pi*np.sqrt(2)+1),
               y_range=(-np.pi*np.sqrt(2)-1, np.pi*np.sqrt(2)+1))
    f.circle('Xs', 'Ys', source=source)

    transf = figure(x_range=f.x_range,
                    y_range=f.y_range,
                    tools=TOOLS,
                    title="trans")
    transf.circle('transXs', 'transYs', source=source, size=6)

    degree = init_degree
    def update():
        nonlocal degree
        degree += 1
        new_mat = rot_mat(degree)
        transXs, transYs = new_mat @ np.array([Xs, Ys])
        source.data = dict(Xs=Xs,
                           Ys=Ys,
                           transXs=transXs,
                           transYs=transYs)
        transf.title.text = "theta={}".format(degree % 360)

    grid = gridplot([[f, transf]])
    plot = column(Div(text="<h2>Transform before and after</h2>"),
                  grid)
    document = curdoc()
    document.add_root(plot)
    document.add_periodic_callback(update, 60)


main()
add_periodic_callback に update 関数を突っ込むことで周期的に update を呼び出して $\theta$ を1度ずつずらしたときの像を描画します.
ここで注意なのは
if __name__ == '__main__':
      main()
のようにせず, そのまま main() を書いておくことです.そうしておかないと実行しても空のページが出力されてしまいます. Referenceとして挙げている方法で session を用いるのも可能なのですが,なぜか起動に時間がかかるのでそのようにはしていません.
実行例
動かして見ましょう.bokeh パッケージをインストールすると bokeh コマンドが使えます.
$ bokeh serve --show anim_rot.py
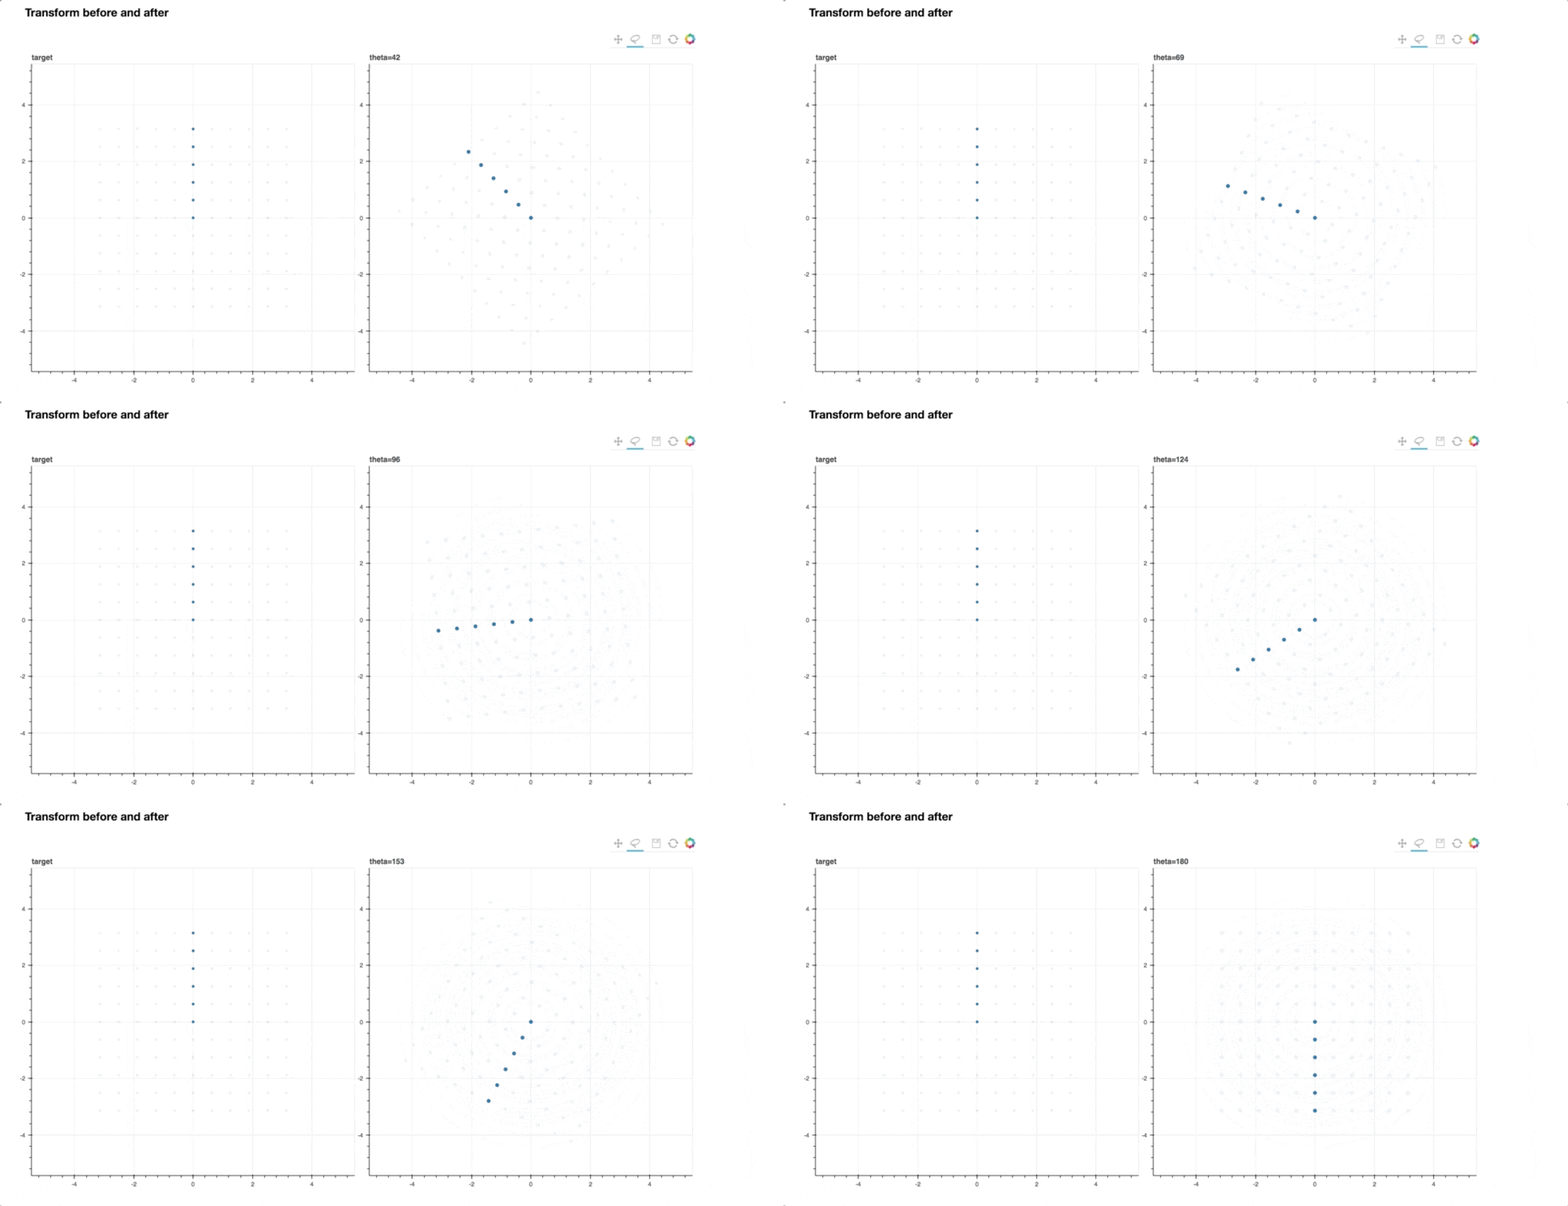
そうするとブラウザが立ち上がり下画面のように動くはずです.
GIFでキャプチャーするツールで動画化しています.
想像通り回転している様子がわかります.そして思っていたよりもカクカクせずに動いてくれますね.
