はじめに
※このブログはAidemy Premiumのカリキュラムの一環で、受講修了条件を満たすために公開しています。
普段リチウムイオン電池の研究開発に携わっており、
電池性能とEVの価格に興味がありタイトルのテーマを選択してみました。
◇実行環境
・Google Colaboratory (Google Colab)
・Python 3.10.12
! python -- version
Python 3.10.12
方針
- データベースの確認と前処理
- モデル(リッジ回帰)による評価
- 考察
- 再評価
1.データベースの確認
データセットは下記のものを使用
https://www.kaggle.com/datasets/fatihilhan/electric-vehicle-specifications-and-prices/data
kaggleからデータセットをダウンロードし読み込みます。
データセットはGoogleドライブ上に保存しています。
Googleドライブ上のデータファイルを読み込むには、事前にdriveのインポートとマウントを行う必要があります。
from google.colab import drive
drive.mount('/content/drive')
import pandas as pd
df = pd.read_csv("/content/drive/MyDrive/EV_cars.csv")
print("◆先頭10行表示: ")
print(df.head(10))
print()

print("◆行数、カラム数確認: ")
print(df.shape)
print()

print("◆データ型確認: ")
print(df.dtypes)
◆先頭10行表示:
   Battery                             Car_name  \
0     75.0  Tesla Model Y Long Range Dual Motor
1     57.5                        Tesla Model 3
2     60.5                           BYD ATTO 3
3     61.7               MG MG4 Electric 64 kWh
4     75.0  Tesla Model 3 Long Range Dual Motor
5     57.5                        Tesla Model Y
6     71.0                      BMW iX xDrive40
7     64.0           Volvo EX30 Single Motor ER
8     44.0                         Citroen e-C3
9     82.5     BYD SEAL 82.5 kWh AWD Excellence

                                       Car_name_link  Efficiency  Fast_charge  \
0  https://ev-database.org/car/1619/Tesla-Model-Y...         172        670.0
1     https://ev-database.org/car/1991/Tesla-Model-3         137        700.0
2        https://ev-database.org/car/1782/BYD-ATTO-3         183        370.0
3  https://ev-database.org/car/1708/MG-MG4-Electr...         171        630.0
4  https://ev-database.org/car/1992/Tesla-Model-3...         149        780.0
5     https://ev-database.org/car/1743/Tesla-Model-Y         164        580.0
6   https://ev-database.org/car/1472/BMW-iX-xDrive40         197        480.0
7  https://ev-database.org/car/1910/Volvo-EX30-Si...         173        550.0
8      https://ev-database.org/car/2039/Citroen-e-C3         176        320.0
9  https://ev-database.org/car/2002/BYD-SEAL-825-...         170        530.0

   Price.DE.  Range  Top_speed  acceleration..0.100.
0    59017.0    435        217                   5.0
1    46220.0    420        201                   6.1
2    44625.0    330        160                   7.3
3    39990.0    360        160                   7.9
4    55220.0    505        201                   4.4
5    47567.0    350        217                   6.9
6    77300.0    360        200                   6.1
7    41790.0    370        180                   5.3
8    23300.0    250        135                  11.0
9    53668.0    485        180                   3.8

◆行数、カラム数確認:
(360, 9)

◆データ型確認:
Battery                 float64
Car_name                 object
Car_name_link            object
Efficiency                int64
Fast_charge             float64
Price.DE.               float64
Range                     int64
Top_speed                 int64
acceleration..0.100.    float64
dtype: object
データフレームの構造は 360行, 9列あることがわかります。
各カラムの内容は以下の通りです。
・Battery: 車両のバッテリーの容量 [kWh]
・Car_name: EV車の名前
・Car_name_link: EV データベースの対応するページへの直接リンク
・Efficiency: 車両のエネルギー効率評価 [Wh/km]
・Fast_charge: 急速充電性能(ある特定の充電状態までにかかる時間[min.])
・Price.DE.: ドイツでの価格[個人的にはドルな気がします]
・Range: 一回の充電での航続可能距離[km]
・Top_speed: 最高速度[km/h]
・Acceleration..0.100.: 停止状態から時速100km/h到達までにかかる時間[s]
df.drop(['Car_name','Car_name_link'], axis=1, inplace=True)
df.info()
df.isna().sum()
<class 'pandas.core.frame.DataFrame'>
RangeIndex: 360 entries, 0 to 359
Data columns (total 7 columns):
 #   Column                Non-Null Count  Dtype
---  ------                --------------  -----
 0   Battery               360 non-null    float64
 1   Efficiency            360 non-null    int64
 2   Fast_charge           358 non-null    float64
 3   Price.DE.             309 non-null    float64
 4   Range                 360 non-null    int64
 5   Top_speed             360 non-null    int64
 6   acceleration..0.100.  360 non-null    float64
dtypes: float64(4), int64(3)
memory usage: 19.8 KB

Battery                  0
Efficiency               0
Fast_charge              2
Price.DE.               51
Range                    0
Top_speed                0
acceleration..0.100.     0
dtype: int64
Fast_chargeに2個
priceに51個の欠損値があることがわかります。
priceの欠損値の個数が多いですが
全て削除していきます。
df.dropna(how='any', inplace=True)
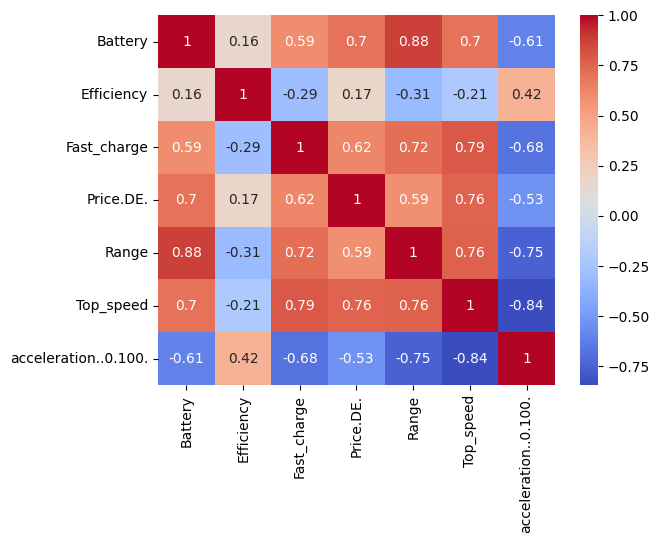
ヒートマップで各値の相関を確認しておきます。
# feature selection
import seaborn as sns
sns.heatmap(df.corr(), cmap='coolwarm', annot=True)
<Axes: >

2.モデル(リッジ回帰)による評価
モデルはリッジ回帰を使用してみます。
from sklearn.model_selection import train_test_split

X_train, X_test, y_train, y_test = train_test_split(df.drop('Price.DE.', axis=1), df['Price.DE.'], test_size= 0.5, random_state=0)
from sklearn.linear_model import Ridge
model = Ridge()
model.fit(X_train, y_train)
# test_X, test_yに対する決定係数を出力
print("Ridge regression:{}".format(model.score(X_train, y_train)))
Ridge regression:0.693593488924271
リッジ回帰による決定係数は0.69359…とあまりよくない結果でした。
3.考察
決定係数が悪い理由としてデータセットの少なさが原因の一つではないかと考えました。
欠損値の削除でデータ数が減ってしまいました。
またもう一つの理由として考えられるのは、EV車のメーカーブランドという特徴量が組み込まれていないことです。
そこで、メーカーブランドという特徴量を組み込んで再評価してみたいと考えました。
4.再評価
1.では削除したカラムのCar_nameに着目すると
すべてcar_brandが頭にきてその後ろはスペースで区切られています。
そこで元データのcsvファイルを編集することでcar_nameをcar_brandとしました。
新しいcsvファイルをGoogleドライブ上に保存して、
1.同様にデータを確認してきます。
from google.colab import drive
drive.mount('/content/drive')
import pandas as pd
df = pd.read_csv("/content/drive/MyDrive/EV_cars2.csv")
print("◆先頭10行表示: ")
print(df.head(10))
print()

print("◆行数、カラム数確認: ")
print(df.shape)
print()

print("◆データ型確認: ")
print(df.dtypes)
◆先頭10行表示:
   Battery Car_brand  Efficiency  Fast_charge  Price.DE.  Range  Top_speed  \
0     75.0     Tesla         172        670.0    59017.0    435        217
1     57.5     Tesla         137        700.0    46220.0    420        201
2     60.5       BYD         183        370.0    44625.0    330        160
3     61.7        MG         171        630.0    39990.0    360        160
4     75.0     Tesla         149        780.0    55220.0    505        201
5     57.5     Tesla         164        580.0    47567.0    350        217
6     71.0       BMW         197        480.0    77300.0    360        200
7     64.0     Volvo         173        550.0    41790.0    370        180
8     44.0   Citroen         176        320.0    23300.0    250        135
9     82.5       BYD         170        530.0    53668.0    485        180

   acceleration..0.100.
0                   5.0
1                   6.1
2                   7.3
3                   7.9
4                   4.4
5                   6.9
6                   6.1
7                   5.3
8                  11.0
9                   3.8

◆行数、カラム数確認:
(360, 8)

◆データ型確認:
Battery                 float64
Car_brand                object
Efficiency                int64
Fast_charge             float64
Price.DE.               float64
Range                     int64
Top_speed                 int64
acceleration..0.100.    float64
dtype: object
ここで新たに作成したCar_brandに関して確認してみます。
# variety列のユニーク
print(df["Car_brand"].unique())
# variety列のユニーク数
print(df["Car_brand"].nunique())
['Tesla' 'BYD' 'MG' 'BMW' 'Volvo' 'Citroen' 'Renault' 'Hyundai' 'Kia'
 'Rolls-Royce' 'Hongqi' 'Fiat' 'CUPRA' 'Dacia' 'Opel' 'Audi' 'Toyota'
 'Smart' 'Volkswagen' 'Peugeot' 'Skoda' 'Mini' 'Jeep' 'Nissan' 'Mercedes'
 'Zeekr' 'Polestar' 'Lucid' 'Honda' 'Lotus' 'Subaru' 'Fisker' 'Mazda'
 'Maxus' 'Lexus' 'Ford' 'XPENG' 'ORA' 'NIO' 'VinFast' 'Jaguar' 'SsangYong'
 'Genesis' 'Aiways' 'Porsche' 'Maserati' 'DS' 'Seres' 'e.Go' 'Elaris'
 'Abarth']
51
確認したところブランドの被りはなさそうで51種類あることがわかります。
次にOne-HotエンコーディングでCar_brandを特徴量として組み込んでいきます。
df2= pd.get_dummies(df, dtype=int)
df2= df2.dropna(how='any')
次に2.同様にリッジ回帰を行います。
# splitting
from sklearn.model_selection import train_test_split

X_train, X_test, y_train, y_test = train_test_split(df2.drop('Price.DE.', axis=1), df2['Price.DE.'], test_size= 0.5, random_state=0)
from sklearn.linear_model import Ridge
# リッジ回帰
model = Ridge(random_state=0)
model.fit(X_train, y_train)

# test_X, test_yに対する決定係数を出力
print("Ridge regression:{}".format(model.score(X_train, y_train)))
Ridge regression:0.8729181346944722
結果は0.87291...とCar_brandを特徴量に含めない場合と比べて改善しました。
最後に
データセットにCar brandをOne-Hotエンコーディングを用いて
特徴量に含めることでリッジ回帰の決定係数を高めることができました。
このことから、EV車の価格に関してメーカーによるところがあるとわかりました。
リチウムイオン電池の開発に携わっているものから見ると
1.で出たヒートマップを見て
Price.DEと正の相関が強いのはBattery, Top_speed, Fast_chargeなので
電池のエネルギー密度、出力特性、急速充電特性が大事なんだなあと思いましたが
それは結構ハードル高いですなあ…
データセットにはないEV車が何年乗れるか(電池性能では寿命特性)や
販売台数などもあるとさらに面白い知見が得られそうな気がしました。