Motivation
-
nn.Moduleでモデルの作り方をAIで学んでいる際に"中間層の可視化"を提案されたので、デモデータを使って試してみた(みてもらった)
Result
活性化層通過後の値をheatmapで可視化
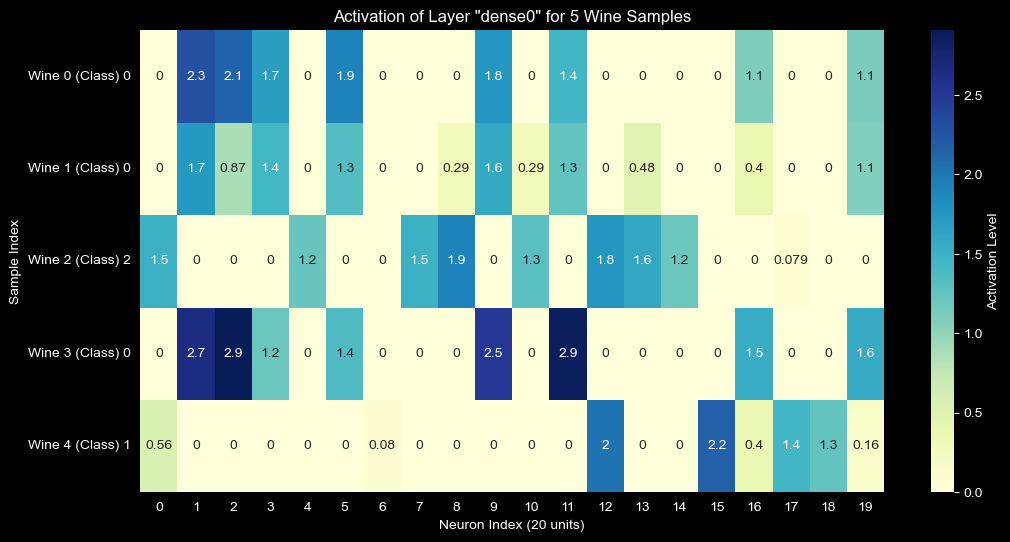
Wineデータセットにおけるdense0層の活性化ヒートマップ
- class毎に異なるニューロンが発火している
- どのクラスにも発火しない(=死んでいる)ニューロンも存在する
- 以下のアクションへ繋げられる
- 重みの可視化:
net.module_.dense0.weightをヒートマップにすると、「どの入力(アルコール度数や色など)がどのニューロンに強く影響しているか」が分かります。 - 誤分類の解析: モデルが間違えたサンプルだけを可視化して、正解サンプルと発火パターンがどう違うか比較するのも非常に面白いですよ。
- 重みの可視化:
Code
1. 必要なモジュールのインポート
imports.py
import numpy as np
import matplotlib.pyplot as plt
import seaborn as sns
import torch
from torch import nn
import torch.nn.functional as F
from sklearn.datasets import load_wine
from sklearn.preprocessing import StandardScaler
from sklearn.model_selection import train_test_split
from skorch import NeuralNetClassifier
2. nn.Moduleと中間層を取得する関数を定義
# dict to record internal output
activation = {}

def get_activation(name):

    # modelとinputはhook内では使用しないがregister_forward_hookから渡されるのでcatch用に必要
    def hook(model, input, output):

        # record values after ReLU
        activation[name] = F.relu(output).detach()

    return hook


class WineClassifier(nn.Module):

    def __init__(self, num_units=20):
        super().__init__()

        self.dense0 = nn.Linear(13, num_units)
        self.dense1 = nn.Linear(num_units, 10)
        self.output = nn.Linear(10, 3)

    def forward(self, X):
        X = self.dense0(X)
        X = self.dense1(F.relu(X))
        X = self.output(F.relu(X))

        return X
3. sklearnのdatasetを使ってfit
data = load_wine()
X = data.data.astype(np.float32)
y = data.target.astype(np.int64)

X_train, X_test, y_train, y_test = train_test_split(X, y, test_size=0.2, random_state=42)

scaler = StandardScaler()
X_train = scaler.fit_transform(X_train)
X_test = scaler.transform(X_test)

device = 'mps' if torch.backends.mps.is_available() else 'cpu'
net = NeuralNetClassifier(
    WineClassifier,
    module__num_units=20,
    criterion=nn.CrossEntropyLoss,
    optimizer=torch.optim.Adam,
    lr=0.01,
    max_epochs=20,
    device=device,
    verbose=0,
)

net.fit(X_train, y_train)
4. 中間層の値を取得し、heatmap表示
# 中間層の活性化を取得するために、dense0層にフックを登録します。
# このフックは、net.forwardが実行されるたびに中間層の出力を2で定義したactivationへ辞書形式で記録します。
net.module_.dense0.register_forward_hook(get_activation('dense0'))

samples = X_test[:5]
net.forward(samples)

plt.figure(figsize=(12, 6))
sns.heatmap(activation['dense0'].cpu().numpy(), annot=True, cmap='YlGnBu', cbvar_kws={'label': 'Activation Level'})
plt.title('Activation of Layer "dense0" for 5 Wine Samples')
plt.xlabel('Neuron Index (20 units)')
plt.ylabel('Sample Index')
plt.yticks(ticks=np.arange(5)+0.5, labels=[f'Wine {i} (Class) {y_test[i]}' for i in range(5)], rotation=0)
plt.show()
Thoughts
- 一目でわかるので便利
- 死んでるニューロンがあるのがわかりやすかった
- ニューラルネットの仕組みを視覚的にイメージしやすい
- AIってとても便利な先生。何聞いても怒らないし。
Next
- plot部分を任意の中間層に対して実行出来れば汎用性高まりそう
# こんな感じ?
def show_internal_activation(name: str):
    if name not in activation.keys():
        getattr(net.module_, name).register_forward_hook(get_activation(name))

    samples = X_test[:5]
    net.forward(samples)

    plt.figure(figsize=(12, 6))
    sns.heatmap(activation[name].cpu().numpy(), annot=True, cmap='YlGnBu', cbar_kws={'label': 'Activation Level'})
    plt.title(f'Activation of Layer "{name}" for 5 Wine Samples')
    plt.xlabel('Neuron Index (20 units)')
    plt.ylabel('Sample Index')
    plt.yticks(ticks=np.arange(5)+0.5, labels=[f'Wine {i} (Class) {y_test[i]}' for i in range(5)], rotation=0)
    plt.show()