ただのplotだけではつまらない
plotにアイコンや図を使う関数達を本記事ではご紹介いたします。

library(ggcats),library(ggdogs),library(ggbernie)
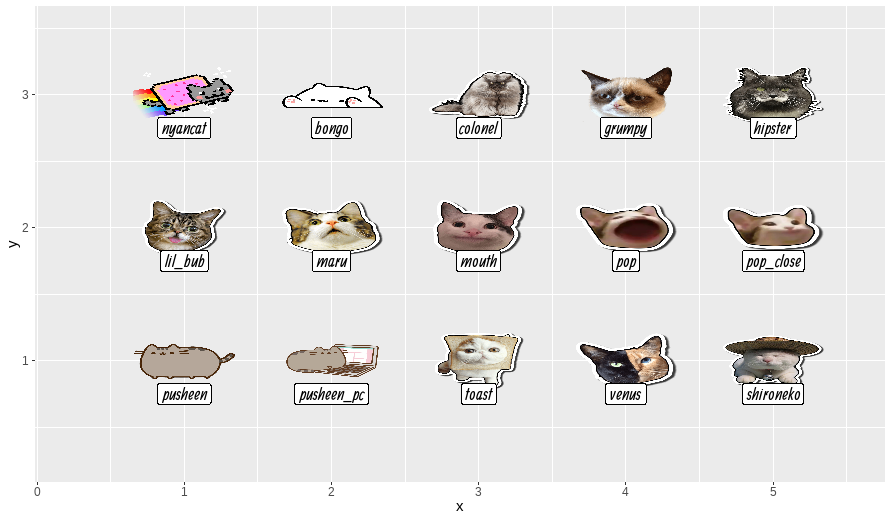
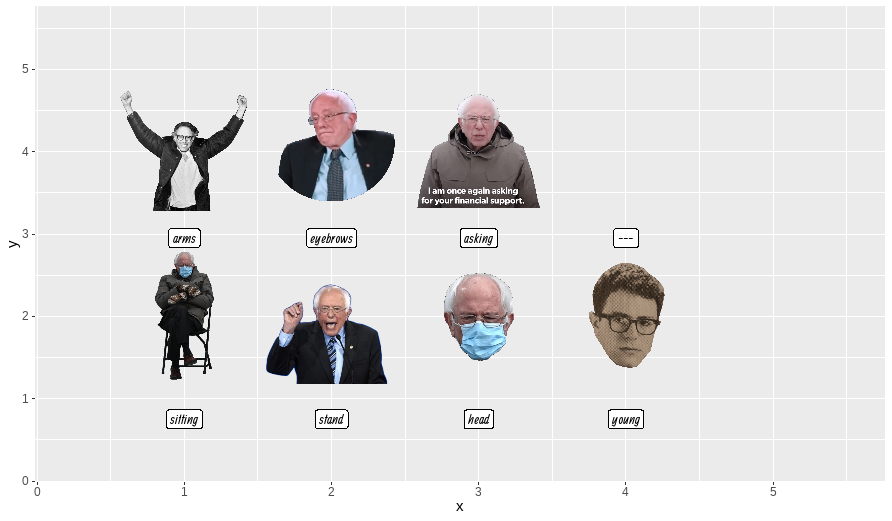
犬のdogeやネコのpop catのようなミーム画像、バーニー・サンダースさんの画像をプロットに使えるようにしたパッケージです。
ミーム画像の元ネタや派生由来はご興味があれば各自でお調べください。
remotes::install_github("R-CoderDotCom/ggdogs@main")
remotes::install_github("R-CoderDotCom/ggbernie@main")
remotes::install_github("R-CoderDotCom/ggcats@main")

library(ggcats)
grid <- expand.grid(1:5, 3:1)

df <- data.frame(x = grid[, 1],
                 y = grid[, 2],
                 image = c("nyancat", "bongo", "colonel", "grumpy", "hipster",
                           "lil_bub", "maru", "mouth", "pop", "pop_close",
                           "pusheen", "pusheen_pc", "toast", "venus", "shironeko"))

ggplot(df) +
  geom_cat(aes(x, y, cat = image), size = 3) +
  geom_label(aes(x, y - 0.25, label = image), size = 5) +
  xlim(c(0.25, 5.5)) +
  ylim(c(0.25, 3.5))
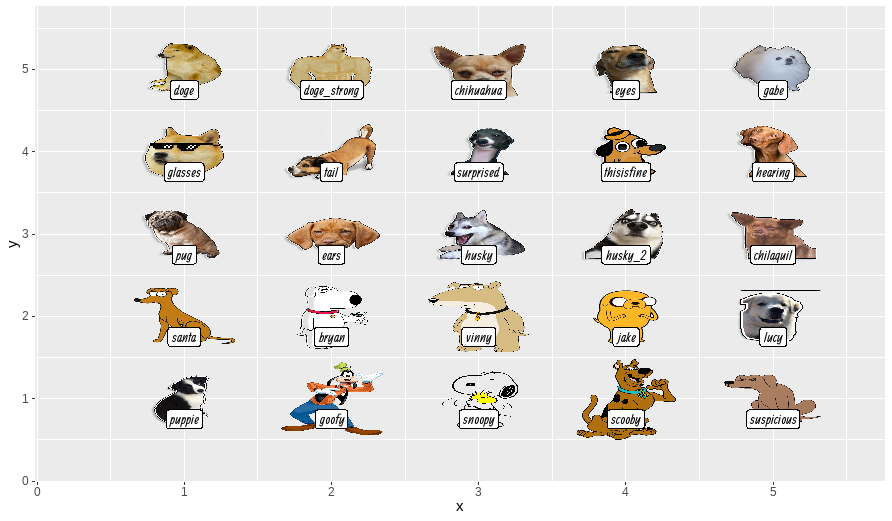
library(ggdogs)
grid <- expand.grid(1:5, 5:1)

df <- data.frame(x = grid[, 1],
                 y = grid[, 2],
                 image = c("doge", "doge_strong", "chihuahua", "eyes", "gabe", "glasses", "tail", "surprised",
                           "thisisfine", "hearing", "pug", "ears", "husky", "husky_2", "chilaquil", "santa", "bryan", "vinny", "jake",
                           "lucy", "puppie", "goofy", "snoopy", "scooby", "suspicious"))

ggplot(df) +
  geom_dog(aes(x, y, dog = image), size = 3) +
  geom_label(aes(x, y - 0.25, label = image), size = 4) +
  xlim(c(0.25, 5.5)) +
  ylim(c(0.25, 5.5))
library(ggbernie)
grid <- expand.grid(1:4, c(1,3.2))

df <- data.frame(x = grid[, 1],
                 y = grid[, 2],
                 image = c("sitting", "stand", "head", "young",
                           "arms", "eyebrows", "asking","---"))

ggplot(df) +
  geom_point(aes(x,y),shape="")+
  geom_bernie(aes(1, 2),bernie = "sitting", size = 2) +
  geom_bernie(aes(2, 2),bernie = "stand", size = 2) +
  geom_bernie(aes(3, 2),bernie = "head", size = 2) +
  geom_bernie(aes(4, 2),bernie = "young", size = 2) +
  geom_bernie(aes(1, 4),bernie = "arms", size = 2) +
  geom_bernie(aes(2, 4),bernie = "eyebrows", size = 2) +
  geom_bernie(aes(3, 4),bernie = "asking", size = 2) +
  geom_label(aes(x, y - 0.25, label = image), size = 4) +
  xlim(c(0.25, 5.5)) +
  ylim(c(0.25, 5.5))
ggcatにはpop cat画像の口が開いた場面と閉じた場面があるので、これとgganimateを組み合わせて以下のような図も作ることができます。
library(ggcats)
library(gganimate)

df <- data.frame(x=seq(0,5,length=100),y=sin(seq(0,5,length=100)),g=rep("group_1",100),cat=rep(c("pop_close", "pop"), length=100))

p <- df %>%
ggplot(aes(x = x, y = y,group=g)) +
  geom_line(size = 2) +
  ggtitle("POPCAT plot") +
  geom_cat(aes(cat = cat), size = 5) +
  xlab("pop pop pop ...") +
  ylab("")+
  transition_reveal(x)

anim_save("popcat.gif", p)

library(ggimage)
ggimageは様々なアイコンや絵文字ソースを指定したgeom_*()関数を持っています。
たとえばplotの点の代わりにイメージ画像をプロットするgeom_image関数があります。
devtools::install_github("GuangchuangYu/ggimage")
library("ggimage")

set.seed(2)
df <- data.frame(x = rnorm(6),
                 y = rnorm(6),
                 image = sample(c("https://www.r-project.org/logo/Rlogo.png",
                                  "https://avatars.githubusercontent.com/u/52575713?s=40&v=4"),size=6, replace = TRUE)
)

df %>%
  ggplot(aes(x=x,y=y))+
  geom_image(aes(image=image),size=0.1)+
  ggtitle("ggimage")

こちらはポケモンキャラの画像をプロットに使う関数です。
df %>%
  ggplot(aes(x=x,y=y))+
  geom_pokemon(aes(image=ifelse(x>0, 'pikachu', 'tauros')), size=.1)

プロットに使っているポケモンキャラはこちらの方が作っている画像を引用してきています。
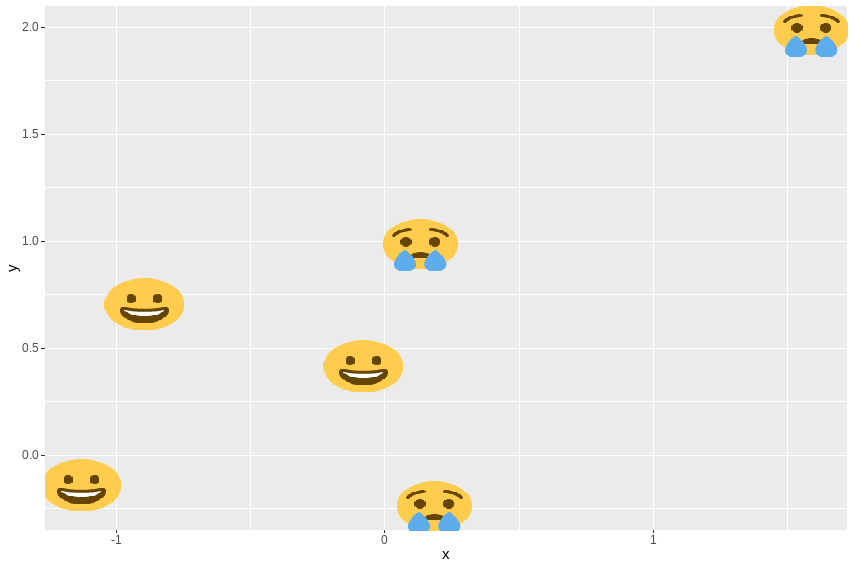
ほかにもツイッターで使われる絵文字をプロットに使うためのgeom_emoji関数
df %>%
  ggplot(aes(x=x,y=y))+
  geom_emoji(aes(image=ifelse(x>0, '1f622', '1f600')), size=.1)
他にもツイッチ絵文字と、国旗をプロットに使うgeom関数があるのですが、APIの変更やリンク切れ等により現在は使えなくなっています。
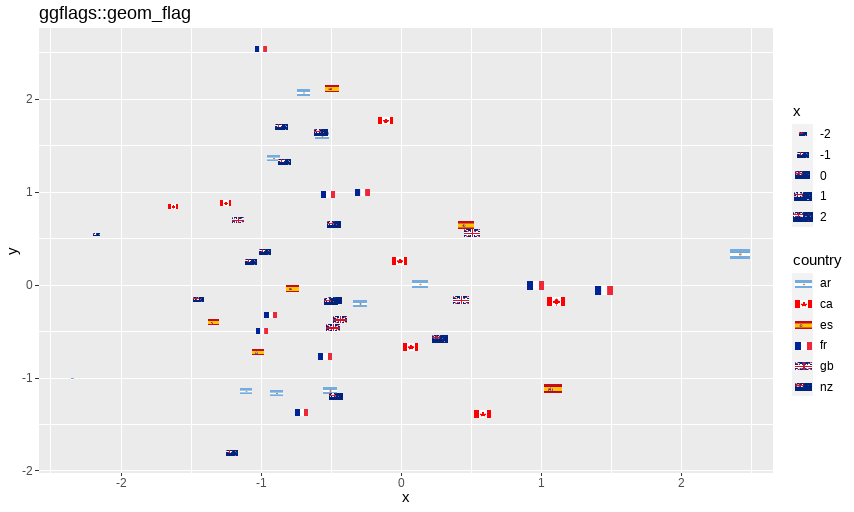
library(ggflags)
先述したggimageパッケージにも国旗を表示する関数はあるのですが、リンクが切れているため、こちらも紹介しておきます。
こちらはgeom_flagのみを扱うパッケージです。
devtools::install_github("baptiste/ggflags")
library(ggflags)

set.seed(1234)
d <- data.frame(x=rnorm(50), y=rnorm(50),
                country=sample(c("ar","fr", "nz", "gb", "es", "ca"), 50, TRUE),
                stringsAsFactors = FALSE)
ggplot(d, aes(x=x, y=y, country=country, size=x)) +
  ggflags::geom_flag() +
  scale_country()+
  ggtitle("ggflags::geom_flag")
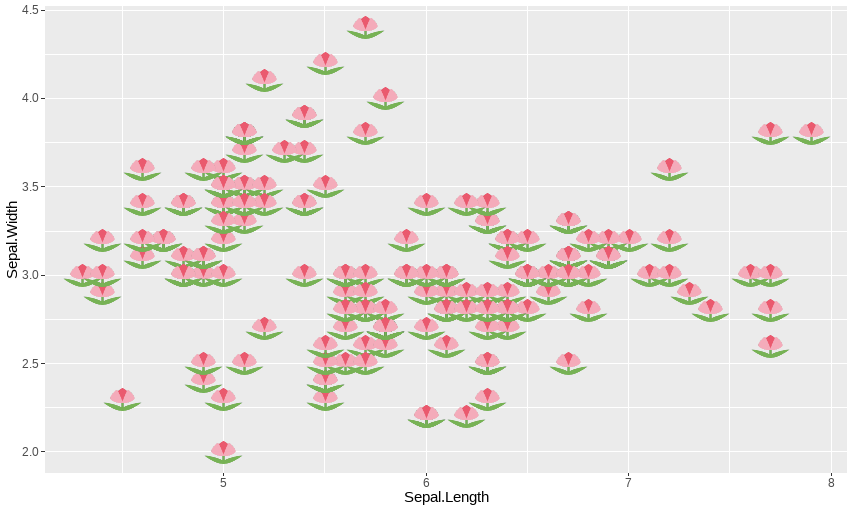
library(emoGG)
ツイッターで使われる絵文字を図中に配置できるパッケージです。
devtools::install_github("dill/emoGG")
library(emoGG)
emoji_search("tulip")
> emoji_search("tulip")
             emoji             code keyword
1929         tulip            1f337 flowers
1930         tulip            1f337   plant
1931         tulip            1f337  nature
1932         tulip            1f337  summer
1933         tulip            1f337  spring
4595     copyright               a9      ip
5538 liechtenstein 1f1f1\\U0001f1ee      li
まず、emoji_search関数を使って、絵文字を探す必要があります。まずチューリップを探します。
ggplot(iris, aes(x=Sepal.Length, y=Sepal.Width, color = Species)) +
  geom_emoji(emoji="1f337")
library(cowplot)
背景に画像を使う場合や、図中にイラストを配置したい場合にはmagickで読み込みcowplotで重ねます。
library(cowplot)
library(magick)

img <- image_read(path="C:\\Users\\ringa\\Desktop\\job_scientist_mad.png") %>%
  image_resize("570x380") %>%
  image_colorize(35, "white")

cowplot_p <- p +
  theme_void() +
  theme(axis.line = element_line(color = "grey40", size = 0.3))

ggdraw() +
  draw_image(img)+
  draw_plot(cowplot_p)

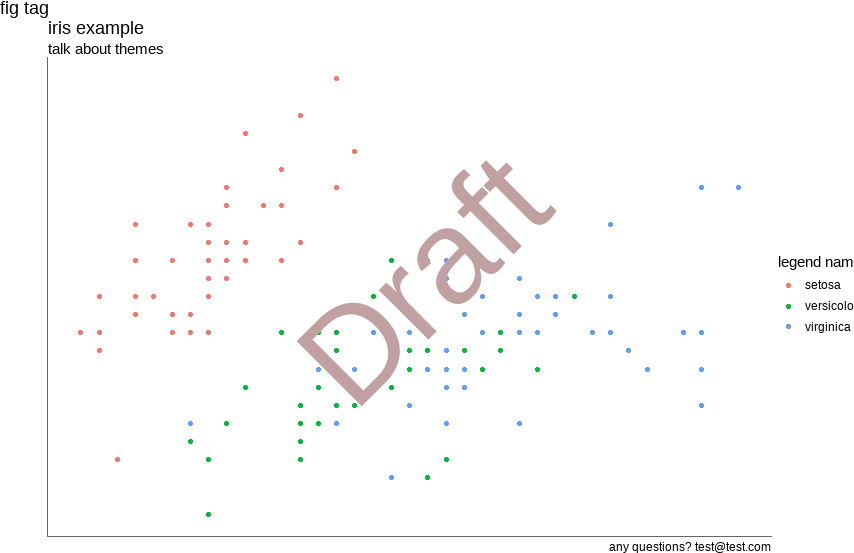
文字ラベルを図中にプリントするにはdraw_labelを使います。
ggdraw(cowplot_p) +
  draw_label("Draft", color = "#C0A0A0", size = 100, angle = 45)
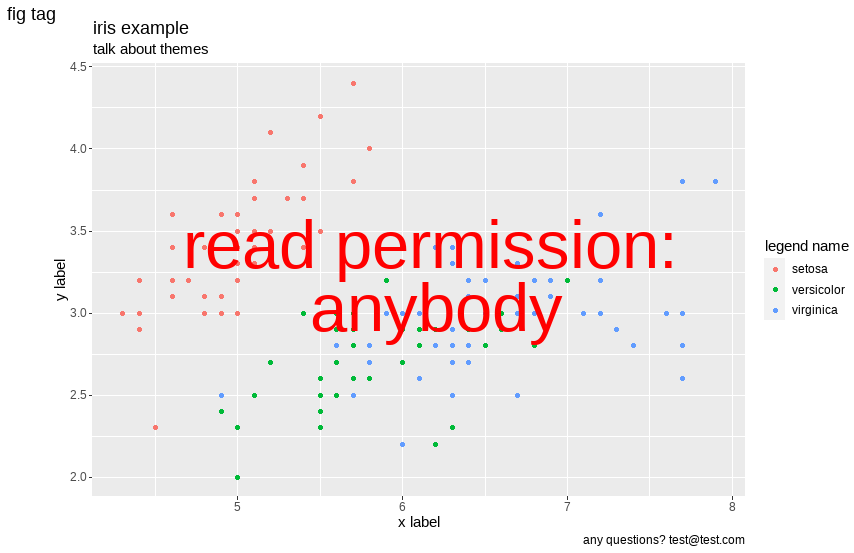
ggdraw(p) +
  draw_label("read permission: \n anybody", color = "red", size = 50, angle = 0)
magickパッケージにはフレームごとに図を貼り付ける機能があるので、gif画像をフレームごとに切り分けて他の図と合成し、その後組み合わせてgifにすることも可能です。
library(fs)
library(magick)

ggsave(p+theme(legend.position = "None"),filename = "p.png",width = 4, height = 4, dpi = 300)
background <- image_read("p.png") %>% image_resize("600x600")

file_path <- dir_ls("C:\\Users\\ringa\\Desktop\\gif")
gif_1 <- image_read(file_path[1]) %>% image_resize("200x200")
my_gif_1 <- image_composite(background,gif_1, offset = "+10+400")

animation <- image_animate(image_join(my_gif_1))
image_write(animation, "my_gif.gif")

使ったgifはこちら。