python==3.8
plotly==4.10.0
pie(円,ドーナッツ)
基本の円
もはや円グラフについての説明は必要ないだろう
import plotly.express as px
df = px.data.tips()
fig = px.pie(df, values='tip', names='day',
             title='pie plot with PX')
fig.show()
graph_objectsで
import plotly.graph_objects as go
df = px.data.tips()
fig = go.Figure(data=[go.Pie(labels=df['day'],
                             values=df['tip'])])

fig.update_traces(hoverinfo='label+percent',
                  textinfo='value',
                  textfont_size=20,
                  marker=dict(line=dict(width=2)))
fig.show()
ドーナッツにする
import plotly.graph_objects as go

fig = go.Figure(data=[go.Pie(labels=df['day'],
                             values=df['tip'],
                     hole=.3)
                     ])

fig.update_traces(hoverinfo='label+percent',
                  textinfo='value',
                  textfont_size=20,
                  marker=dict(line=dict(width=2)))
fig.show()
sunburst(日輪型)
pathに親として指定したもの順で指定する
値の大きさはvaluesで指定
import plotly.express as px
df = px.data.tips()
fig = px.sunburst(df, path=['day', 'time', 'sex'], values='total_bill')
fig.show()
色変更
値の大きさについても色分けしてくれる
import plotly.express as px
df = px.data.tips()
fig = px.sunburst(df, path=['day', 'time', 'sex'], values='total_bill',color='total_bill')
fig.show()
alluvial(沖積図)
基本
import plotly.express as px
df = px.data.tips()
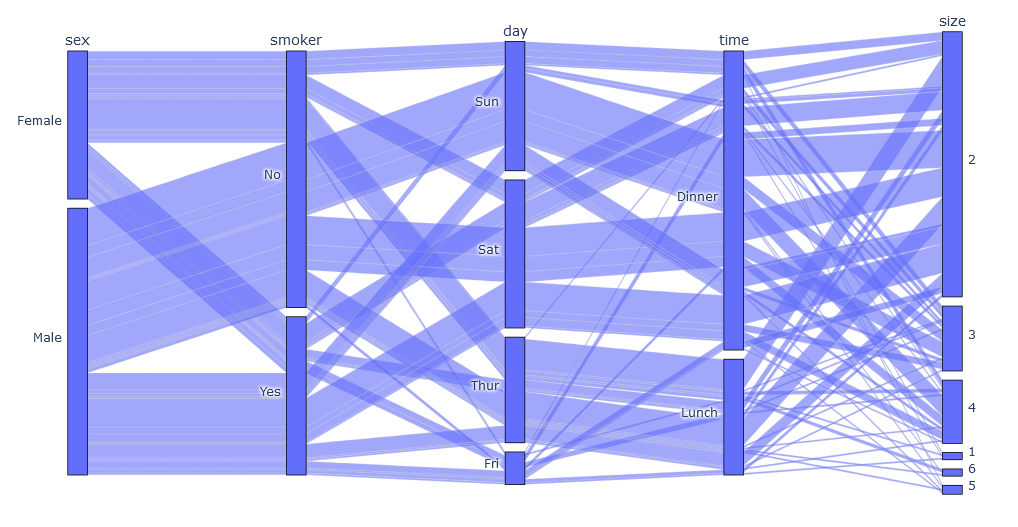
fig = px.parallel_categories(df)
fig.show()
parallel_categories
カテゴリ変数をcountして平行図とする
どのカテゴリが、他の変数ではどの割合で存在しているのかを可視化するにはcolorで指定する
import plotly.express as px
df = px.data.tips()
fig = px.parallel_categories(df, color="size",
                             color_continuous_scale=px.colors.sequential.Inferno)
fig.show()
parallel_coordinates
連続値の一点一点の配分を確認する
まとまった割合というよりも、視覚的にどこが多いのか、どの程度ばらつくのかを確認できる
import plotly.express as px
df = px.data.tips()
fig = px.parallel_coordinates(df, color="size",
                              dimensions=['total_bill', 'size', 'tip'],
                              color_continuous_midpoint=2)
fig.show()
sankyダイアグラム(流量図)
エネルギーの流量をサンキーさんが可視化したことから始まったグラフ
import plotly.graph_objects as go

fig = go.Figure()

fig.add_trace(

    go.Sankey(

    node = dict(pad = 15,thickness = 20,line = dict(color = "black", width = 0.5),
    label = ["n0","n1","n2","n3","n4"],
    color = "blue"),

    link = dict(
      source = [0,1,2,3],
      target =[1,2,3,4],
      value = [5,10,15,20])

    )
)

fig.update_layout(title_text="Sankey Diagram", font_size=10)
fig.show()
実数で入力されたsourceからtargetに対して矢印が引かれ、矢印の厚みはvalueに渡される
labelにはsourceとtargetの中のユニーク数だけ指定する
指定した順とsource,targetの番号の大きさは対応する
データの形とするなら
という状態を作っておいて
受け渡す関係を数値に変換する
そんな前処理をしておくことで、
どのカテゴリがどれだけの流量を握っているか
ほかのカテゴリへ分配される割合
などを調べる
d1 = df.groupby(["sex","smoker"], as_index=False).sum()[["sex","smoker",'total_bill']]
d1.columns = ['sor','tar','total_bill']
d2 = df.groupby(["smoker","day"], as_index=False).sum()[["smoker","day",'total_bill']]
d2.columns = ['sor','tar','total_bill']
d3 = df.groupby(["day","time"], as_index=False).sum()[["day","time",'total_bill']]
d3.columns = ['sor','tar','total_bill']
concat_d = pd.concat([d1, d2, d3],axis=0, ignore_index=True)
label_list = pd.concat([concat_d['sor'],concat_d['tar']],axis=0).unique().astype('str')


for i in range(0,len(label_list)):
    for j in range(0,len(concat_d['sor'])):

        if concat_d['sor'].astype('str')[j]==label_list[i]:
            concat_d['sor'][j]=i

        if concat_d['tar'].astype('str')[j]==label_list[i]:
            concat_d['tar'][j]=i

import plotly.graph_objects as go
fig = go.Figure()

fig.add_trace(

    go.Sankey(

    node = dict(pad = 15,thickness = 20,line = dict(color = "black", width = 0.5),
    label = label_list,
    color = "blue"),

    link = dict(
      source = concat_d.sor,
      target =concat_d.tar,
      value = concat_d.total_bill)

    )
)

fig.update_layout(title_text="Basic Sankey Diagram", font_size=10)
fig.show()
treemap
割合を面積で表現する
費用の使用用途や、在庫割合の確認など
import plotly.express as px
df = px.data.tips()
fig = px.treemap(df,
                 path=[px.Constant('back ground'),'sex','day','time'],
                 values='total_bill',
                 color='sex'
                )
fig.show()
pathに渡した順に枝分けをする
背景を作っておきたい場合はconstantで任意のものをつくっておく
funnel(漏斗)基本
割合の進行を表現できる
webサイト観覧から購入までの減衰などを表現できる
from plotly import graph_objects as go

fig = go.Figure()

fig.add_trace(go.Funnel(
    name = 'Montreal',
    orientation = "h",
    y = ["2018-01-01", "2018-07-01", "2019-01-01", "2020-01-01"],
    x = [100, 60, 40, 20],
    textposition = "inside",
    texttemplate = "%{y| %a. %_d %b %Y}"))

fig.update_layout(yaxis = {'type': 'date'})

fig.show()
いくつかを同時に
from plotly import graph_objects as go

fig = go.Figure()

fig.add_trace(go.Funnel(
    name = 'Montreal',
    orientation = "h",
    y = ["2018-01-01", "2018-07-01", "2019-01-01", "2020-01-01"],
    x = [100, 60, 40, 20],
    textposition = "inside",
    textinfo = "value+percent previous"))

fig.add_trace(go.Funnel(
    name = 'Vancouver',
    orientation = "h",
    y = ["2018-01-01", "2018-07-01", "2019-01-01", "2020-01-01"],
    x = [90, 70, 50, 10],
    textposition = "inside",
    textinfo = "value+percent previous"))


fig.add_trace(go.Funnel(
    name = 'Toronto',
    orientation = "h",
     y = ["2018-01-01", "2018-07-01", "2019-01-01","2020-01-01","2021-01-01"],
    x = [100, 60, 40,30, 20,10],
    textposition = "inside",
    textinfo = "value+percent previous"))

fig.update_layout(yaxis = {'type': 'date'})

fig.show()
text infoはpercent totalならば全体を100としての割合を示す
funnelを平面で表す
import plotly.express as px
fig = px.funnel_area(names=["The 1st","The 2nd", "The 3rd", "The 4th", "The 5th"],
                    values=[5, 4, 3, 2, 1],
                    color=[5, 3, 3, 3, 1])
fig.show()


