コーセラのMLを見て回帰(regression)が出てきたので単回帰についてまとめる。
ついでに興味あった重回帰も書きなぐっていく。
単回帰
回帰は連続値の関係性を使って、予測値を計算する方法。
単回帰では目的変数 y を予測するために、説明変数 x があり、
予測式は y = f(x) となる。
いくつかの(x, y)のデータ(教師データ)を使ってモデル式を作って
新しい予測したいデータ(x,?)の?を埋めることが目的。
baseのデータセット「cars」を使った。
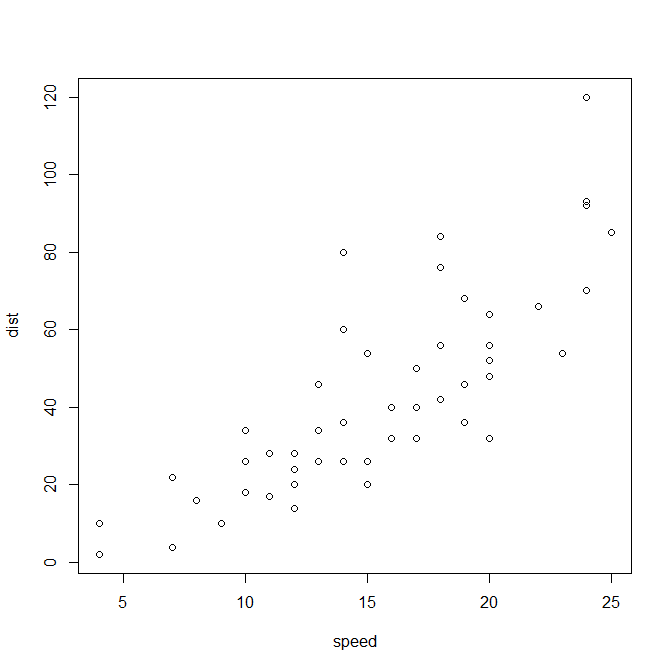
plot(cars)
1920年代の車の速度とブレーキをかけてから停止までの距離
一番右上を見てみると、速度25 で走っている車は停止まで120までは動き続ける。
(単位はマイル/時とメートル?)
plotだけでも相関がありそうで。xとyの関係をモデルにしようとしたら右肩上がりの直線が書けそう。
まずこの時点で二次関数っぽかったら線形の単回帰は避けるべきなんでしょうね。
とりあえず線形単回帰。
model=lm(cars$dist~cars$speed)
model
Call:
lm(formula = cars$dist ~ cars$speed)

Coefficients:
(Intercept)   cars$speed
    -17.579        3.932
速度から停止距離を割り出せるように回帰式を作りmodelに格納した。
model内にはモデル関数が出来ていて
y = 3.932×speed + (-17.579)
切片-17、傾き3.9の直線式が得られた。
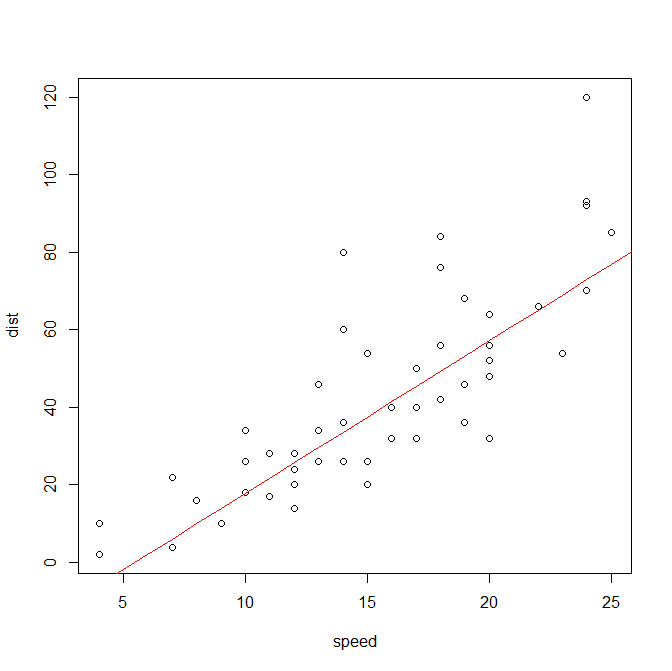
どのくらいデータを説明できていそうなのかplotしてみる。
bind=NULL
for (x in 0:25){
val=3.932*x-17.579
bind=c(bind,val)
}

points(bind,col="red",type="l")
モデルとしてよさそうだけれども傾きがもう少し小さくても良さそう。
右上の外れ値が影響してしまっているのでしょう。
モデルがデータをどれだけ説明しているのか見てみます。
summary(model)
Coefficients:
            Estimate Std. Error t value Pr(>|t|)
(Intercept) -17.5791     6.7584  -2.601   0.0123 *
cars$speed    3.9324     0.4155   9.464 1.49e-12 ***
---
Signif. codes:  0 ‘***’ 0.001 ‘**’ 0.01 ‘*’ 0.05 ‘.’ 0.1 ‘ ’ 1

Residual standard error: 15.38 on 48 degrees of freedom
Multiple R-squared:  0.6511,    Adjusted R-squared:  0.6438
F-statistic: 89.57 on 1 and 48 DF,  p-value: 1.49e-12
決定係数(R-squared)を見ると0.65となっていて
モデル関数で予測した値と、実際の値は65%くらいが一致していそうということでしょうか。
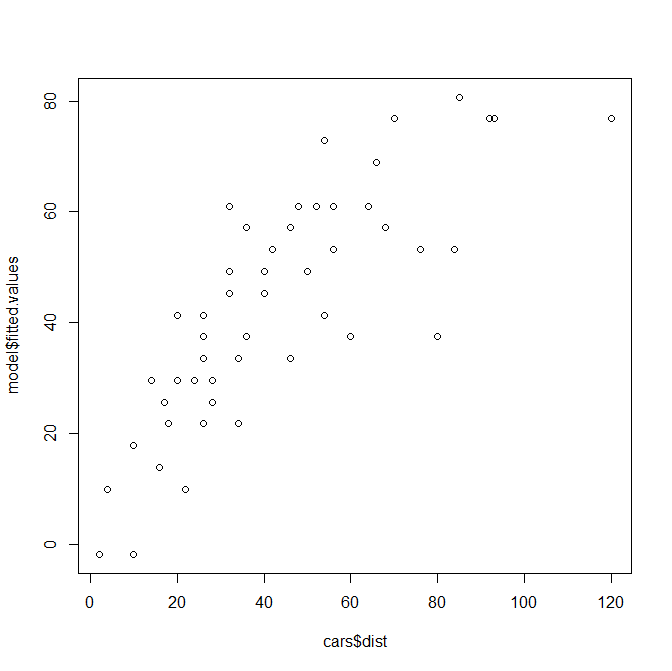
plotしてホントなのか確かめます。
plot(cars$dist,model$fitted.values)
65%ですか。
この図でいう右上の外れていそうな値を抜いてみたらどうなるのでしょうか
外れていそうな値を抜く
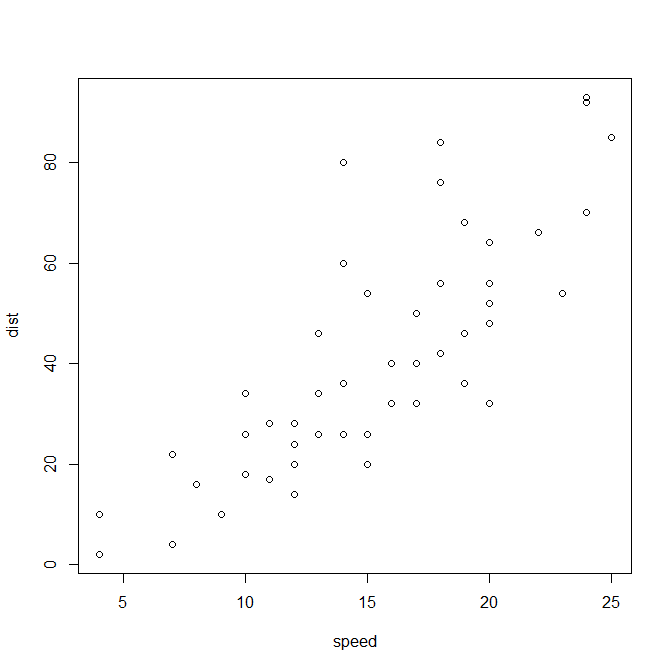
new_data=cars[cars$dist<100,]
# 29行目の120が抜けた
plot(new_data)
大分きれいな関係になっていそうです。
またモデルを作って決定係数を調べてみます。
new_model=lm(new_data$dist~new_data$speed)
summary(new_model)
Call:
lm(formula = new_data$dist ~ new_data$speed)

Residuals:
    Min      1Q  Median      3Q     Max
-26.789  -9.149  -1.672   8.013  43.048

Coefficients:
               Estimate Std. Error t value Pr(>|t|)
(Intercept)    -14.0021     6.2951  -2.224    0.031 *
new_data$speed   3.6396     0.3918   9.290 3.26e-12 ***
---
Signif. codes:  0 ‘***’ 0.001 ‘**’ 0.01 ‘*’ 0.05 ‘.’ 0.1 ‘ ’ 1

Residual standard error: 14.1 on 47 degrees of freedom
Multiple R-squared:  0.6474,    Adjusted R-squared:  0.6399
F-statistic: 86.31 on 1 and 47 DF,  p-value: 3.262e-12
一個外れ値を外したくらいでは変わりませんでした。
傾きがもう少し小さいほうがデータを説明できるモデルになるのでは?
と考えていましたが、
この時代の車は停止するまでの距離が伸びてしまう傾向にあるということをモデルが説明してくれていると考えると納得です。
現在の車のようにロバストな出来ではなかったんですかね。
外れ値と思ったものを抜いて、抜く前と比較して、
その際どちらのモデルを採択するのかしっかり議論するというのは実験した人や実情を知っている人としっかり会話しないといけないのかもしれません。
次の記事は重回帰についてです。


