概要
アルゴリズムの学習記録を投稿します。
今回は蟻本・グラフの2部グラフ判定p93についてです。
問題
p93
頂点数nの無向グラフが与えられます。隣接している頂点同士が違う色になるように、頂点に色を塗っていきます。
2色以内ですべての頂点を塗ることができるか判定してください。
多重辺やループはないものとします。

例1
入力
n=3
graph = [[1,2],[0,2],[0,1]]

出力
"No"

例2
入力
n=4
graph = [[1,3],[0,2],[1,3],[0,2]];

出力
"Yes"
コード部分
    // 2部グラフ判定 p93
    /**
     * @param number{Number}頂点の数
     * @param graphArray{Array} 辺の情報
     * @return ans {String} Yes :二色以内で塗り分け可能 No: 二色以内で塗り分け不可能
     */
    const  checkBipartite = (number,graphArray) =>{
        let i = 0 ;
        const colors = new Array(number).fill(0);

        // 深さ優先探索 他の頂点とを網羅するために使用する。
        /**
         * @param v{Number} 頂点番号
         * @param c{Number}} 色の情報 -1or1が入る。
         * @return ans {String} true :二色以内で塗り分け可能 false: 二色以内で塗り分け不可能
         */
        const dfs= (v,c) =>{
            // console.log(`${v}の色を${c}色に塗る`);
            colors[v] = c;
            console.log(`${i}|なし|def(${i},${c}) | |${v}を${c}色に塗る|${colors}`);
            for(let j = 0;j<graphArray[v].length;j++){
                // 頂点vに対して、隣接する頂点毎にループする。
                // 隣接している頂点が同じ色の場合
                if(colors[graphArray[v][j]] == c){
                    console.log(`${i}|${j}|def(${i},${c}) | colors[graphArray[v][j]] == c  </br> colors[graphArray[${v}][${j}]]( =${colors[graphArray[v][j]]}) == ${c}|${v}と${graphArray[v][j]}は同じ${c}色${colors}`);
                    return false;
                }
                // 隣接している頂点が塗られていない場合異なる色で塗る。
                if(colors[graphArray[v][j]] == 0 && !dfs(graphArray[v][j],-c)){
                    console.log(`${i}|${j}| def(${graphArray[v][j]},${-c} | colors[graphArray[v][j]] == 0  </br> colors[graphArray[${v}][${j}]]( =${colors[graphArray[v][j]]}) == 0 |${v}は塗り替えられていないので${-c}色に塗る|${colors}`);
                    return false;
                }
                console.log(`${i}|${j}|def(${i},${c})| colors[graphArray[v][j]] !== 0 and c  </br> colors[graphArray[${v}][${j}]]( =${colors[graphArray[v][j]]}) !== 0  and ${c}|${v}と${graphArray[v][j]}は既に異なる色に塗られている|${colors}`);
            }
            // 全ての色が塗れた場合。
            // console.log("色が塗れた場合");
            console.log(`${i}|なし|def(${i},${c}) | |すべての頂点が塗れた|${colors}`);
            return true;
        }
        // 全ての頂点に対してループする。
        console.log(`i|j|!dfs(i,1)|条件|行動|graphの色`)
        for( i= 0;i<number; i++){
            if(colors[i] == 0){
                if(!dfs(i,1)){
                    console.log("No");
                    return "No";
                }
            }
        }
        console.log("Yes");
        return "Yes";
    }

    const testCase2Number = 4;
    const testCase2Array = [[1,3],[0,2],[1,3],[0,2]];
    // Yes
    checkBipartite(testCase2Number,testCase2Array)
python tutor
コードを実際に動かせるwebサイト
ステップ実行かつステップ事の変数を確認できる特徴があります。
その他情報
感想
特になし
依存関係グラフ
依存関係グラフは変数の結びつきを一目でわかりやすくするための図です。
変数の流れを確認しやすくすることでワーキングメモリの負担を減らすことができます。
作成方法はコード上の変数に丸付けて線を繋げています。
(これいる?)

状態遷移図
計算内容を明示する表。
ステップごとの変数の値を各列に表示します。
複雑な計算を行うコードを理解するのに役立つ表です。
例1
| i | j | !dfs(i,1) | 条件 | 行動 | graphの色 |
|---|---|---|---|---|---|
| 0 | なし | def(0,1) | 0を1色に塗る | 1,0,0 | |
| 0 | なし | def(0,-1) | 1を-1色に塗る | 1,-1,0 | |
| 0 | 0 | def(0,-1) | colors[graphArray[v][j]] !== 0 and c colors[graphArray[1][0]]( =1) !== 0 and -1 | 1と0は既に異なる色に塗られている | 1,-1,0 |
| 0 | なし | def(0,1) | 2を1色に塗る | 1,-1,1 | |
| 0 | 0 | def(0,1) | colors[graphArray[v][j]] == c colors[graphArray[2][0]]( =1) == 1 | 2と0は同じ1色1,-1,1 | |
| 0 | 1 | def(2,1 | colors[graphArray[v][j]] == 0 colors[graphArray[1][1]]( =1) == 0 | 1は塗り替えられていないので1色に塗る | 1,-1,1 |
| 0 | 0 | def(1,-1 | colors[graphArray[v][j]] == 0 colors[graphArray[0][0]]( =-1) == 0 | 0は塗り替えられていないので-1色に塗る | 1,-1,1 |
No
例2
| i | j | !dfs(i,1) | 条件 | 行動 | graphの色 |
|---|---|---|---|---|---|
| 0 | なし | def(0,1) | 0を1色に塗る | 1,0,0,0 | |
| 0 | なし | def(0,-1) | 1を-1色に塗る | 1,-1,0,0 | |
| 0 | 0 | def(0,-1) | colors[graphArray[v][j]] !== 0 and c colors[graphArray[1][0]]( =1) !== 0 and -1 | 1と0は既に異なる色に塗られている | 1,-1,0,0 |
| 0 | なし | def(0,1) | 2を1色に塗る | 1,-1,1,0 | |
| 0 | 0 | def(0,1) | colors[graphArray[v][j]] !== 0 and c colors[graphArray[2][0]]( =-1) !== 0 and 1 | 2と1は既に異なる色に塗られている | 1,-1,1,0 |
| 0 | なし | def(0,-1) | 3を-1色に塗る | 1,-1,1,-1 | |
| 0 | 0 | def(0,-1) | colors[graphArray[v][j]] !== 0 and c colors[graphArray[3][0]]( =1) !== 0 and -1 | 3と0は既に異なる色に塗られている | 1,-1,1,-1 |
| 0 | 1 | def(0,-1) | colors[graphArray[v][j]] !== 0 and c colors[graphArray[3][1]]( =1) !== 0 and -1 | 3と2は既に異なる色に塗られている | 1,-1,1,-1 |
| 0 | なし | def(0,-1) | すべての頂点が塗れた | 1,-1,1,-1 | |
| 0 | 1 | def(0,1) | colors[graphArray[v][j]] !== 0 and c colors[graphArray[2][1]]( =-1) !== 0 and 1 | 2と3は既に異なる色に塗られている | 1,-1,1,-1 |
| 0 | なし | def(0,1) | すべての頂点が塗れた | 1,-1,1,-1 | |
| 0 | 1 | def(0,-1) | colors[graphArray[v][j]] !== 0 and c colors[graphArray[1][1]]( =1) !== 0 and -1 | 1と2は既に異なる色に塗られている | 1,-1,1,-1 |
| 0 | なし | def(0,-1) | すべての頂点が塗れた | 1,-1,1,-1 | |
| 0 | 0 | def(0,1) | colors[graphArray[v][j]] !== 0 and c colors[graphArray[0][0]]( =-1) !== 0 and 1 | 0と1は既に異なる色に塗られている | 1,-1,1,-1 |
| 0 | 1 | def(0,1) | colors[graphArray[v][j]] !== 0 and c colors[graphArray[0][1]]( =-1) !== 0 and 1 | 0と3は既に異なる色に塗られている | 1,-1,1,-1 |
| 0 | なし | def(0,1) | すべての頂点が塗れた | 1,-1,1,-1 |
例3
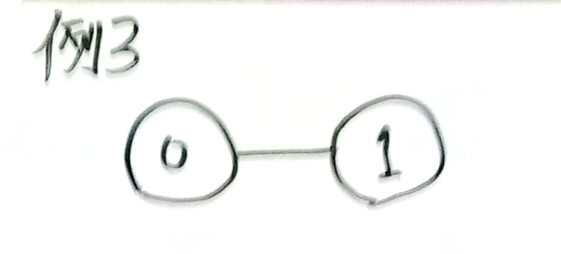
入力
n=2
graph = [[1],[0]]

出力
"Yes"
| i | j | !dfs(i,1) | 条件 | 行動 | graphの色 |
|---|---|---|---|---|---|
| 0 | なし | def(0,1) | 0を1色に塗る | 1,0 | |
| 0 | なし | def(0,-1) | 1を-1色に塗る | 1,-1 | |
| 0 | 0 | def(0,-1) | colors[graphArray[v][j]] !== 0 and c colors[graphArray[1][0]]( =1) !== 0 and -1 | 1と0は既に異なる色に塗られている | 1,-1 |
| 0 | なし | def(0,-1) | すべての頂点が塗れた | 1,-1 | |
| 0 | 0 | def(0,1) | colors[graphArray[v][j]] !== 0 and c colors[graphArray[0][0]]( =-1) !== 0 and 1 | 0と1は既に異なる色に塗られている | 1,-1 |
| 0 | なし | def(0,1) | すべての頂点が塗れた | 1,-1 |
Yes
例4
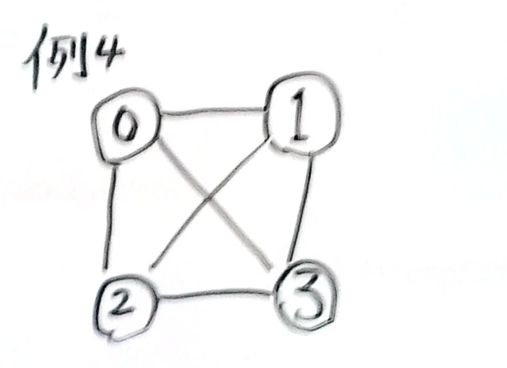
入力
n=4
graph = [[1,2,3],[0,2,3],[0,1,3],[0,1,2]]

出力
"Yes"
| i | j | !dfs(i,1) | 条件 | 行動 | graphの色 |
|---|---|---|---|---|---|
| 0 | なし | def(0,1) | 0を1色に塗る | 1,0,0,0 | |
| 0 | なし | def(0,-1) | 1を-1色に塗る | 1,-1,0,0 | |
| 0 | 0 | def(0,-1) | colors[graphArray[v][j]] !== 0 and c colors[graphArray[1][0]]( =1) !== 0 and -1 | 1と0は既に異なる色に塗られている | 1,-1,0,0 |
| 0 | なし | def(0,1) | 2を1色に塗る | 1,-1,1,0 | |
| 0 | 0 | def(0,1) | colors[graphArray[v][j]] == c colors[graphArray[2][0]]( =1) == 1 | 2と0は同じ1色1,-1,1,0 | |
| 0 | 1 | def(2,1 | colors[graphArray[v][j]] == 0 colors[graphArray[1][1]]( =1) == 0 | 1は塗り替えられていないので1色に塗る | 1,-1,1,0 |
| 0 | 0 | def(1,-1 | colors[graphArray[v][j]] == 0 colors[graphArray[0][0]]( =-1) == 0 | 0は塗り替えられていないので-1色に塗る | 1,-1,1,0 |
No
参考資料
プログラミングコンテストチャレンジブック [第2版] マイナビ p93
プログラマー脳 秀和システム
p73 python tutor
p71 状態遷移表
p69 依存関係グラフ
githubコミット部分