更新履歴
- (2023/01/04)
Astropyとは
Astropyは,天文でよく用いられるFITSファイルを読み書きするためのパッケージ.FITSを画像として出力する関数が充実している.
なぜ極めたいのか
APLpyを用いてよくプロットを作成していたが,どうにも,macOSの更新やARMアーキテクチャに更新が追いついていないようなので,APLpyに頼りきりも良くないなと思ったことが主な要因.同じようなことをこれまでにも記事で書いた.
正確にはAPLpyが悪いわけではなく,APLpyが依存している別のパッケージの更新が間に合っていない様子.PyPI を見る限り,2022年にもAPLpyはリリースされている.そんなこんなでこれまではPyenvでギリギリAPLpyが使用できていた3.6.15をインストールし,APLpyを使用していた.
しかし先日,M2のMacBook Airを購入し,環境構築をしていたところ,3.6.15でAPLpyが入れられないことに気がつき,「もうこれはAPLpyを使っている場合じゃねえ!」と考えた.
そこで,2022年12月19日現在でも,最新のPython 3.11.1にちゃんと対応しているなど,更新され続けているAstropyで全てを完結させることにした.
使用したデータ
野辺山45 m鏡で近傍銀河を観測したCOMINGプロジェクトのアーカイブデータを使用する.
手っ取り早くプロットの仕方を知りたい人向け
さっさと方法だけ知りたい人向けにコピペ欄を用意.
これでも論文とかに使えるように,
- 座標軸
- カラーバー
- カラーバーのラベル
- ビームサイズ (空間分解能)
- グリッド
など,最低限必要な情報を全てプロットしてくれる.
とりあえず実行してみて,おかしいところは適宜修正することをおすすめする.
import matplotlib.pyplot as plt
import matplotlib.cm as cm
from astropy.io import fits
from mpl_toolkits.axes_grid1 import make_axes_locatable
import matplotlib.axes as maxes
from radio_beam import Beam
import astropy.units as u


## Figureのsize ## 適宜調整
width = 10
height = 10

fits_name = 'fits/NGC1087_12CO_RADEC.mom0.fits'
f = fits.open(fits_name)

try:
    from astropy.wcs import WCS
    from astropy.visualization.wcsaxes import WCSAxes
    wcs = WCS(f[0].header)
    fig = plt.figure(figsize=(width, height))
    plt.rcParams['font.size'] = 20 ## 適宜調整
    ax = WCSAxes(fig, [0.16, 0.1, 0.8, 0.8], wcs=wcs) ## 適宜調整
    fig.add_axes(ax)
except ImportError:
    ax = plt.subplot(111)

image = ax.imshow(f[0].data, cmap=cm.jet, vmin=400, vmax=900) ## 適宜調整


## colorbar
divider = make_axes_locatable(ax)
colorbar_ax = divider.append_axes("top", "3%", pad="1%", axes_class=maxes.Axes)
cbar = fig.colorbar(image, orientation='horizontal', cax=colorbar_ax)
colorbar_ax.xaxis.set_ticks_position('top')


## color barの単位 ## 適宜調整
plt.title('$\mathrm{km\ s^{-1}}$', x=0.5, y=3)

## 軸の名前 ## 適宜調整
ax.set_xlabel('RA (J2000)')
ax.set_ylabel('Dec (J2000)')

##====beam sizeを楕円として描画==========
## beam sizeがFITSに入っていないとエラーが出るはず
header = fits.getheader(fits_name)
beam_size = Beam.from_fits_header(header)
my_beam = Beam(beam_size.major.value*3600*u.arcsec,
               beam_size.minor.value*3600*u.arcsec,
               beam_size.pa.value*u.deg)
ycen_pix, xcen_pix = 3, 3 ## 適宜調整
pixscale = f[0].header["CDELT1"]*3600 * u.arcsec
ellipse_artist = my_beam.ellipse_to_plot(xcen_pix, ycen_pix, pixscale)
_ = ax.add_artist(ellipse_artist)
##===================================

##====グリッド線の追加 ## 適宜調整======
ax.grid(color='black', ls='dotted')
##==================================

fig.savefig('fig/test.png')
実行結果
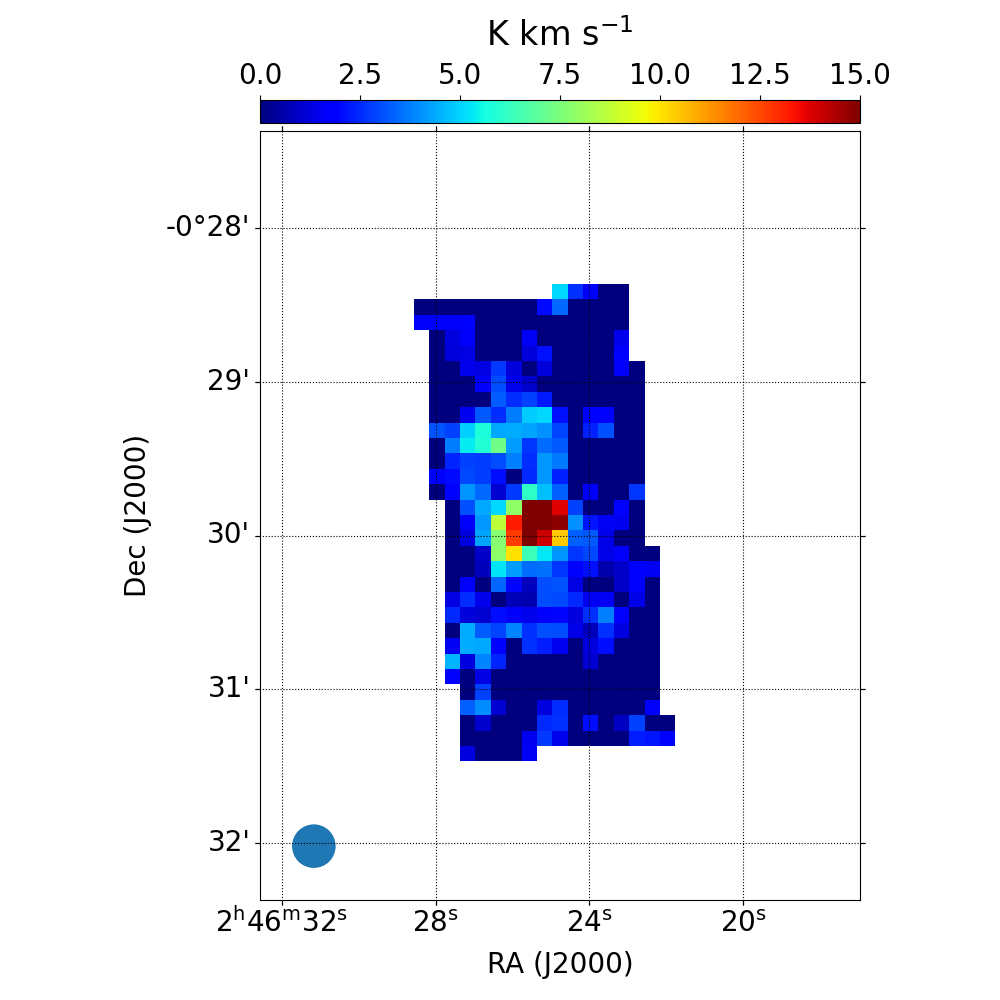
それぞれの解説は気が向いたら...笑
もう一つ別のパターン
いろいろ参考にしてもう一つ別のパターンを作ってみた.
import matplotlib.pyplot as plt
from astropy.wcs import WCS
from astropy.io import fits
from mpl_toolkits.axes_grid1 import make_axes_locatable
import matplotlib.axes as maxes
from radio_beam import Beam
import astropy.units as u

fits_name = 'fits/NGC1087_12CO_RADEC.mom0.fits'

hdu = fits.open(fits_name)[0]
wcs = WCS(hdu.header)

fig = plt.figure()
ax = plt.subplot(projection=wcs, label='overlays')
image = ax.imshow(hdu.data, vmin=400, vmax=900, origin='lower')

ax.grid(color='black', ls='dotted')
ax.coords[0].set_axislabel('Right Ascension (J2000)')
ax.coords[1].set_axislabel('Declination (J2000)')
fig.add_axes(ax)

#colorbar
divider = make_axes_locatable(ax)
colorbar_ax = divider.append_axes("top", "3%", pad="1%", axes_class=maxes.Axes)
cbar = fig.colorbar(image, orientation='horizontal', cax=colorbar_ax)
colorbar_ax.xaxis.set_ticks_position('top')
plt.title('$\mathrm{km\ s^{-1}}$', x=0.5, y=3)

header = fits.getheader(fits_name)
beam_size = Beam.from_fits_header(header)
my_beam = Beam(beam_size.major.value*3600*u.arcsec,
               beam_size.minor.value*3600*u.arcsec,
               beam_size.pa.value*u.deg)
ycen_pix, xcen_pix = 3, 3
pixscale = hdu.header["CDELT1"]*3600*u.arcsec
ellipse_artist = my_beam.ellipse_to_plot(xcen_pix, ycen_pix, pixscale)
_ = ax.add_artist(ellipse_artist)
plt.savefig(fname='fig/test.png')
実行結果

参考
※pyregionは使用していないがプロットの方法を参考にした.