元々は...
APLpyというモジュールのFITSFigureという関数(?)を使用していたが,どうやら最近のPythonのアップデートに追いついていないらしく,3.6か3.7ぐらいでアップデートが終了し,それ以降のバージョンに対応していないようだった.
Pyenvでバージョン管理をしているので使えるといえば使えるがなんだか気持ち悪い.
ということで最新のPython 3.10.1でもpip経由できちんとインストールできたastropyだけでFITS画像の出力ができないか模索していた.
そんなこんなで...
いろいろ参考にしてastropyとmatplotlibでFITS画像をプロットすることができたのだが...
import matplotlib.pyplot as plt
import matplotlib.cm as cm
from astropy.io import fits
import pyregion
from mpl_toolkits.axes_grid1 import make_axes_locatable

# read in the image
fits_name = 'fits/ngc1187_stellar_mass_distribution_3.6um_4.5um.fits'
f = fits.open(fits_name)

try:
    from astropy.wcs import WCS
    from astropy.visualization.wcsaxes import WCSAxes
    wcs = WCS(f[0].header)
    fig = plt.figure()
    ax = WCSAxes(fig, [0.1, 0.1, 0.8, 0.8], wcs=wcs)
    fig.add_axes(ax)
except ImportError:
    ax = plt.subplot(111)

image = ax.imshow(f[0].data, cmap=cm.jet, vmin=0., vmax=2e6)
reg_name = 'region/continuum.reg'
r = pyregion.open(reg_name).as_imagecoord(header=f[0].header)

#colorbar
divider = make_axes_locatable(ax)
colorbar_ax = divider.append_axes("top", "3%", pad="1%")
cbar = fig.colorbar(image, orientation='horizontal', cax=colorbar_ax)
colorbar_ax.xaxis.set_ticks_position('top')
plt.title('Stellar mass distribution', x=0.5, y=3)


from pyregion.mpl_helper import properties_func_default

# Use custom function for patch attribute
def fixed_color(shape, saved_attrs):
    attr_list, attr_dict = saved_attrs
    attr_dict["color"] = "red"
    kwargs = properties_func_default(shape, (attr_list, attr_dict))
    return kwargs

# select region shape with tag=="Group 1"
r1 = pyregion.ShapeList([rr for rr in r if rr.attr[1].get("tag") == "Group 1"])
patch_list1, artist_list1 = r1.get_mpl_patches_texts(fixed_color)
r2 = pyregion.ShapeList([rr for rr in r if rr.attr[1].get("tag") != "Group 1"])
patch_list2, artist_list2 = r2.get_mpl_patches_texts()
for p in patch_list1 + patch_list2:
    ax.add_patch(p)
for t in artist_list1 + artist_list2:
    ax.add_artist(t)

plt.show()
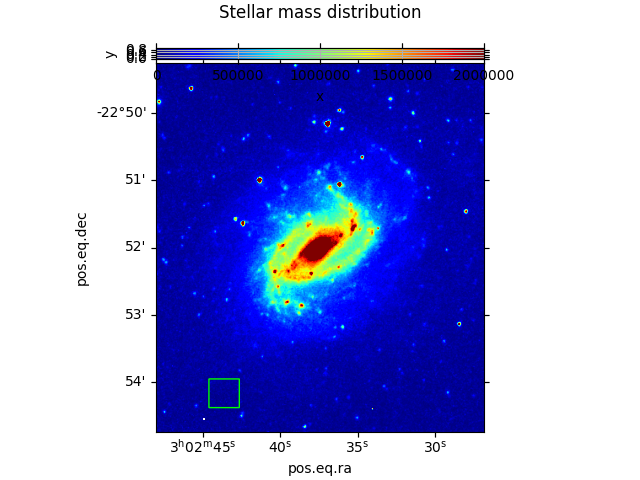
カラーバーがなんかおかしい...なにこれ...
y軸消えないし,メッシュ入ってるし,x軸の目盛も画像に入り込んでる...
ちゃんとcolorbar_ax.xaxis.set_ticks_position('top')とか指定してるのに...
色々調べた結果,解決策を発見!
冒頭にimport matplotlib.axes as maxesを追加し,colorbar_ax = divider.append_axes("top", "3%", pad="1%")の部分に,axes_class=maxes.Axesを追加するのみ!
import matplotlib.pyplot as plt
import matplotlib.cm as cm
from astropy.io import fits
import pyregion
from mpl_toolkits.axes_grid1 import make_axes_locatable
import matplotlib.axes as maxes

# read in the image
fits_name = 'fits/ngc1187_stellar_mass_distribution_3.6um_4.5um.fits'
f = fits.open(fits_name)

try:
    from astropy.wcs import WCS
    from astropy.visualization.wcsaxes import WCSAxes
    wcs = WCS(f[0].header)
    fig = plt.figure()
    ax = WCSAxes(fig, [0.1, 0.1, 0.8, 0.8], wcs=wcs)
    fig.add_axes(ax)
except ImportError:
    ax = plt.subplot(111)

image = ax.imshow(f[0].data, cmap=cm.jet, vmin=0., vmax=2e6)
reg_name = 'region/continuum.reg'
r = pyregion.open(reg_name).as_imagecoord(header=f[0].header)

#colorbar
divider = make_axes_locatable(ax)
colorbar_ax = divider.append_axes("top", "3%", pad="1%", axes_class=maxes.Axes)
cbar = fig.colorbar(image, orientation='horizontal', cax=colorbar_ax)
colorbar_ax.xaxis.set_ticks_position('top')
plt.title('Stellar mass distribution', x=0.5, y=3)


from pyregion.mpl_helper import properties_func_default

# Use custom function for patch attribute
def fixed_color(shape, saved_attrs):
    attr_list, attr_dict = saved_attrs
    attr_dict["color"] = "red"
    kwargs = properties_func_default(shape, (attr_list, attr_dict))
    return kwargs

# select region shape with tag=="Group 1"
r1 = pyregion.ShapeList([rr for rr in r if rr.attr[1].get("tag") == "Group 1"])
patch_list1, artist_list1 = r1.get_mpl_patches_texts(fixed_color)
r2 = pyregion.ShapeList([rr for rr in r if rr.attr[1].get("tag") != "Group 1"])
patch_list2, artist_list2 = r2.get_mpl_patches_texts()
for p in patch_list1 + patch_list2:
    ax.add_patch(p)
for t in artist_list1 + artist_list2:
    ax.add_artist(t)

plt.show()
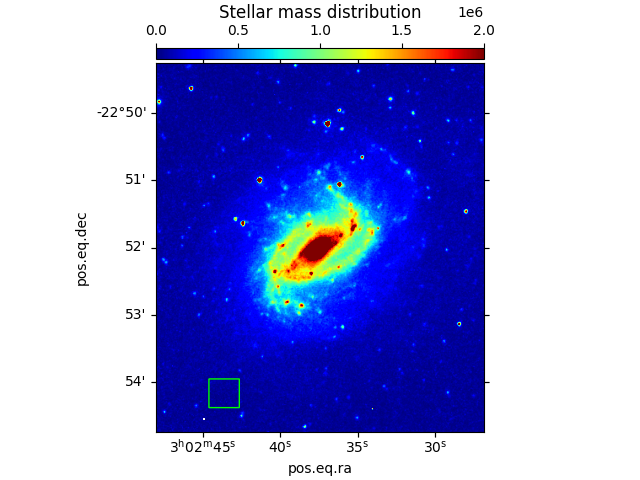
あとは微調整するだけだ!ふううううううううう
参考
余談
まあ,pyregionというモジュールはまだ3.10.1に対応していないんですけどね...
サポート続けてくれるかな...