はじめに
Kaggleで使えるPandasの使い方を備忘録として残します。
随時更新していく予定です。
更新:2019年1月29日15時 様々なコンペで使える便利な関数を追記しました。
Pandas Basics Cheat Sheet(基本的な使い方)
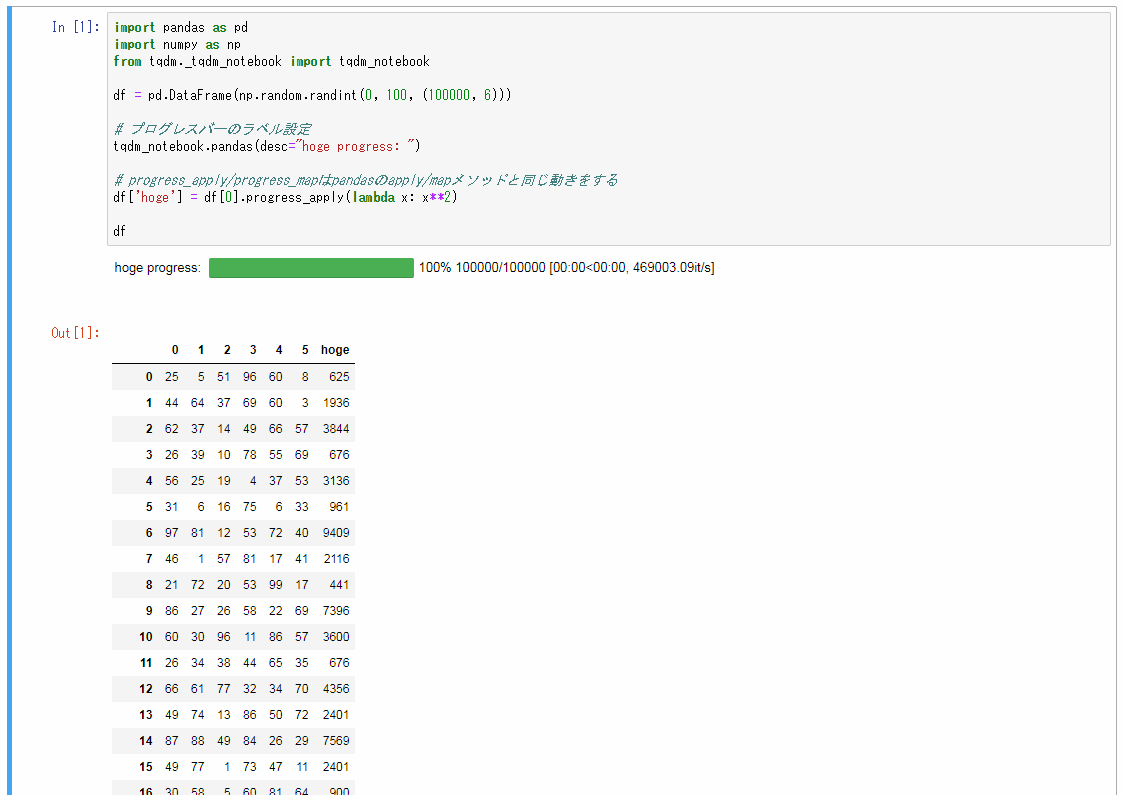
プログレスバーを表示する
df.apply()やdf.map()の進捗を見たい時に、
tqdmというライブラリを使うことでプログレスバーを表示することができます。
import pandas as pd
import numpy as np
from tqdm._tqdm_notebook import tqdm_notebook

df = pd.DataFrame(np.random.randint(0, 100, (100000, 6)))

# プログレスバーのラベル設定
tqdm_notebook.pandas(desc="hoge progress: ")

# progress_apply/progress_mapはpandasのapply/mapメソッドと同じ動きをする
df['hoge'] = df[0].progress_apply(lambda x: x**2)

df
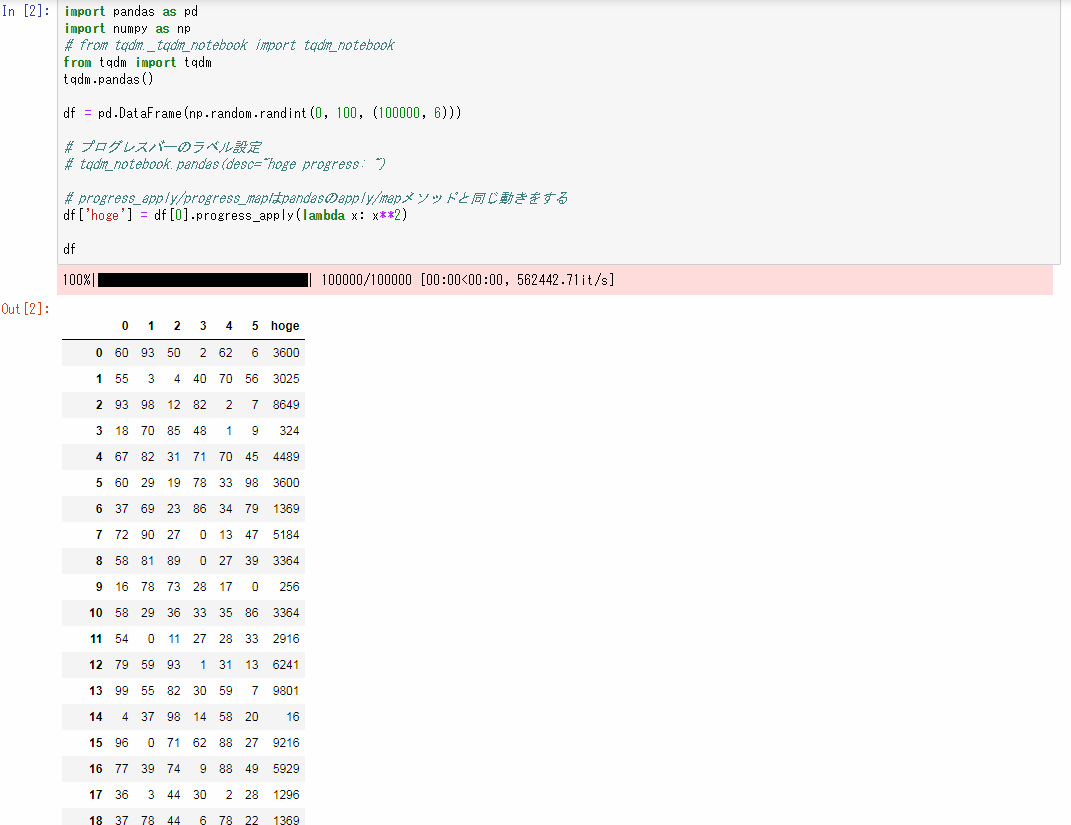
実行結果
import pandas as pd
import numpy as np
from tqdm import tqdm
tqdm.pandas()

df = pd.DataFrame(np.random.randint(0, 100, (100000, 6)))

# progress_apply/progress_mapはpandasのapply/mapメソッドと同じ動きをする
df['hoge'] = df[0].progress_apply(lambda x: x**2)

df
実行結果
様々なコンペで使える便利な関数
int型、float型のカラムに対し、最大値・最小値の幅などを判定し、最適なデータ型に変換してくれる関数です。
最初に書かれたのはいつかわかりませんが、2019年1月29日現在Kaggleで開催されている、
「Elo Merchant Category Recommendation」や「Microsoft Malware Prediction」コンペのKernelで使われています。
import pandas as pd
import numpy as np

def reduce_mem_usage(df, verbose=True):
    numerics = ['int16', 'int32', 'int64', 'float16', 'float32', 'float64']
    start_mem = df.memory_usage(deep=True).sum() / 1024**2
    for col in df.columns:
        col_type = df[col].dtypes
        if col_type in numerics:
            c_min = df[col].min()
            c_max = df[col].max()
            if str(col_type)[:3] == 'int':
                if c_min > np.iinfo(np.int8).min and c_max < np.iinfo(np.int8).max:
                    df[col] = df[col].astype(np.int8)
                elif c_min > np.iinfo(np.int16).min and c_max < np.iinfo(np.int16).max:
                    df[col] = df[col].astype(np.int16)
                elif c_min > np.iinfo(np.int32).min and c_max < np.iinfo(np.int32).max:
                    df[col] = df[col].astype(np.int32)
                elif c_min > np.iinfo(np.int64).min and c_max < np.iinfo(np.int64).max:
                    df[col] = df[col].astype(np.int64)
            else:
                if c_min > np.finfo(np.float16).min and c_max < np.finfo(np.float16).max:
                    df[col] = df[col].astype(np.float16)
                elif c_min > np.finfo(np.float32).min and c_max < np.finfo(np.float32).max:
                    df[col] = df[col].astype(np.float32)
                else:
                    df[col] = df[col].astype(np.float64)
    end_mem = df.memory_usage(deep=True).sum() / 1024**2
    if verbose: print('Mem. usage decreased to {:5.2f} Mb ({:.1f}% reduction)'.format(end_mem, 100 * (start_mem - end_mem) / start_mem))
    return df

# 使用する時は、以下のようにtrain/testデータフレームを引数に渡すだけ
train = reduce_mem_usage(train)
# 出力結果 →  Mem. usage decreased to 1923.79 Mb (0.0% reduction)
CSVにJson形式のカラムがある場合の読み込み方
Kaggleの「Google Analytics Customer Revenue Prediction」というコンペのデータセットには
Json形式のデータが含まれています。
そのようなデータへの対応方法はいくつかありますが、そのうちの一つを紹介します。
参考にしたKernelは以下です。元からコメントで細かく説明があるため、それを日本語訳しています。
https://www.kaggle.com/kabure/simple-eda-exploring-the-consumer-patterns
import os # it's a operational system library, to set some informations
import random # random is to generate random values

import pandas as pd # to manipulate data frames
import numpy as np # to work with matrix

import json # to convert json in df
from pandas.io.json import json_normalize # to normalize the json file


columns = ['device', 'geoNetwork', 'totals', 'trafficSource'] # json形式のカラムを設定

dir_path = "../input/" # CSVファイルの格納されているパスを指定

# ファイルの先頭スキップする行数のセット
p = 0.1 # *** ここではデータセットの50%を使う *** #

# Json形式をテーブルに変換する関数
def json_read(df):
    data_frame = dir_path + df

    #CSVを読みこむ
    df = pd.read_csv(data_frame,
                     converters={column: json.loads for column in columns}, # Json形式のカラムを正しく読み込む
                     dtype={'fullVisitorId': 'str'}, # IDのカラムは0落ちを防ぐため、stringで読みこむ
                     skiprows=lambda i: i>0 and random.random() > p)# ランダムにインポートされる行数

    for column in columns: #データフレームに変換
        # Jsonからテーブルに標準化する
        column_as_df = json_normalize(df[column])
        # Jsonカラムのカテゴリとサブカテゴリを設定する
        column_as_df.columns = [f"{column}.{subcolumn}" for subcolumn in column_as_df.columns]
        # 値を抽出後、オリジナルのカラムを削除
        df = df.drop(column, axis=1).merge(column_as_df, right_index=True, left_index=True)

    # データの行数と列数をプリント
    print(f"Loaded {os.path.basename(data_frame)}. Shape: {df.shape}")
    return df # 完成したデータフレームを返却

%%time
# %%time はコードの実行タイミングの計算をします。

df_train = json_read("train.csv")
結果
Loaded train.csv. Shape: (90396, 54)
CPU times: user 19.3 s, sys: 1.2 s, total: 20.5 s
Wall time: 21.1 s
大量データを読み込む場合の対処法
Kaggleのコンペのデータセット(CSVの場合)にはかなりの容量がある場合があります。
このような膨大データはデータタイプを指定すると問題なく読み込めます。
# 一部のみを読み込み、各データ型を調べます。
train_df.info()

# 調べたデータ型を定義します。
# 実際は下記よりもカラムがありますが、省略しています。
dtypes = {
        'MachineIdentifier':                                    'category',
        'ProductName':                                          'category',
        'EngineVersion':                                        'category',
        'AppVersion':                                           'category',
        'AvSigVersion':                                         'category',
        'IsBeta':                                               'int8',
        'RtpStateBitfield':                                     'float16'
    }

# その後データ型を指定し読み込む
train_df = pd.read_csv('../input/train.csv', dtype=dtypes)
時系列データ操作
formatの主な例は以下の通りです。
| 書式 | 説明 |
|---|---|
| %Y | 4桁の年 |
| %y | 2桁の年 |
| %m | 2桁の月[01,02,...,12] |
| %d | 日[2桁] |
| %H | 時間[24時間] |
| %I | 時間[12時間] |
| %M | 分 |
| %S | 秒 |
| %z | タイムゾーン UTCのずれの分[+HHMM] |
| %F | %Y-%m-%d のalias |
| %f | sub-second [0.000 sec] |
train.date = pd.to_datetime(train.date, format="%Y%m%d")
to_datetimeのオプションについて
unit='s'
秒まで出力します
train.date = pd.to_datetime(train.date, unit='s')
日付け変換
Series.dt()で年月日を抽出する
抽出の種類
| Datetime Properties | 説明 |
|---|---|
| Series.dt.date | datetime.dateオブジェクトのnumpy配列を返します |
| Series.dt.time | datetime.timeのnumpy配列を返します |
| Series.dt.year | 日時の年 |
| Series.dt.month | 月は1月= 1、12月= 12 |
| Series.dt.day | 日時の日数 |
| Series.dt.hour | 日時の時間 |
| Series.dt.minute | 日時の分 |
| Series.dt.second | 日時の秒数 |
| Series.dt.microsecond | マイクロ秒 |
| Series.dt.nanosecond | ナノ秒 |
| Series.dt.week | 年の序数 |
| Series.dt.weekofyear | 今年の序数 |
| Series.dt.dayofweek | 月曜日= 0、日曜日= 6の曜日 |
| Series.dt.weekday | Monday = 0、Sunday = 6の曜日 |
| Series.dt.weekday_name | 週の名前(例:金曜日) |
| Series.dt.dayofyear | 年の順番の日 |
| Series.dt.quarter | 日付の四半期 |
| Series.dt.is_month_start | 月の最初の日かどうかを示す論理値 |
| Series.dt.is_month_end | 月の最終日 |
| Series.dt.is_quarter_start | 四半期の初めの日かどうかを示す論理値 |
| Series.dt.is_quarter_end | 四半期の最終日かどうかを示す論理値。 |
| Series.dt.is_year_start | 年の最初の日かどうかを示す論理値。 |
| Series.dt.is_year_end | 最後の年かどうかを示す論理値。 |
| Series.dt.is_leap_year | 日付がうるう年に属するかどうかを示す論理的 |
| Series.dt.daysinmonth | 月の日数 |
| Series.dt.days_in_month | 今月の日数 |
公式ドキュメントpandas.pydata.org
print(df)
#       date	   value
# 0 2016/5/1 0:03	 45
# 1 2017/9/1 0:04	 4
# 2 2016/3/1 0:06	 23
# 3 2018/4/1 0:06	 12
# 4 2017/7/12 0:06	 78
# 5 2018/1/12 0:07	 33
# 6 2018/2/1 0:10	 55
# 7 2018/3/1 0:12	 32
# 8 2018/4/1 0:13	 76
df['date'] = df['date'].dt.date
print(df)

#       date	value
# 0 2016/5/1	 45
# 1 2017/9/1 	 4
# 2 2016/3/1 	 23
# 3 2018/4/1 	 12
# 4 2017/7/12 	 78
# 5 2018/1/12 	 33
# 6 2018/2/1 	 55
# 7 2018/3/1 	 32
# 8 2018/4/1 	 76
Series.dt.dayofweekを使うと、月曜日= 0、日曜日= 6にして返す。
df['date'] = df['date'].dt.dayofweek
print(df)

#     date	value
# 0   6.0	 45
# 1   4.0 	 4
# 2   1.0	 23
# 3   6.0 	 12
# 4   2.0 	 78
# 5   4.0 	 33
# 6   3.0 	 55
# 7   3.0 	 32
# 8   6.0 	 76
重複データの調べ方
ids_train = set(train.fullVisitorId.unique())
ids_test = set(test.fullVisitorId.unique())
print("Unique visitor ids in train:", len(ids_train))
print("Unique visitor ids in test:", len(ids_test))
print("Common visitors in train and test:", len(ids_train & ids_test))
Unique visitor ids in train: 714167
Unique visitor ids in test: 617242
Common visitors in train and test: 7679
カラムの違いの調べ方
print(train_df.columns.difference(test_df.columns))
print(test_df.columns.difference(train_df.columns))
Index(['trafficSource.campaignCode'], dtype='object')
Index([], dtype='object')
データ変換
melt()
- id_vars= 基本軸となるカラムを指定
- var_name= 変数(Variable)となるカラムに名前を付ける
※値(Value)となるカラムに名前を付けることも可能(value_nameを引数に指定)
>>> import pandas as pd
>>> df = pd.DataFrame({'A': {0: 'a', 1: 'b', 2: 'c'},
...                    'B': {0: 1, 1: 3, 2: 5},
...                    'C': {0: 2, 1: 4, 2: 6}})
>>> df
   A  B  C
0  a  1  2
1  b  3  4
2  c  5  6
>>> pd.melt(df, id_vars=['A'], value_vars=['B'])
   A variable  value
0  a        B      1
1  b        B      3
2  c        B      5
>>> pd.melt(df, id_vars=['A'], value_vars=['B', 'C'])
   A variable  value
0  a        B      1
1  b        B      3
2  c        B      5
3  a        C      2
4  b        C      4
5  c        C      6
Seriesの各要素に適用: map()
>>> x = pd.Series([1,2,3], index=['one', 'two', 'three'])
>>> x
one      1
two      2
three    3
dtype: int64
>>> y = pd.Series(['foo', 'bar', 'baz'], index=[1,2,3])
>>> y
1    foo
2    bar
3    baz
>>> x.map(y)
one   foo
two   bar
three baz
map()の引数に辞書dict({key: value})を指定すると、keyと一致する要素がvalueに置き換えられる。
map()では置換されない値がNaNとなる。
DataFrameの各要素に適用: applymap()
map()と同じく、Pythonの組み込み関数、無名関数(lambda)やdefで定義した関数をapplymap()の引数に渡す。
df = pd.DataFrame({'a':[11, 21, 31],
                  'b':[12, 22, 32],
                  'c':[13, 23, 33],
                  'd':[14, 24, 34]})

f_oddeven = lambda x: 'odd' if x % 2 == 1 else 'even'
print(df.applymap(f_oddeven))
     a     b    c     d
0  odd  even  odd  even
1  odd  even  odd  even
2  odd  even  odd  even
DataFrame, Seriesの各行・各列に適用: apply()
一次元配列に適用可能な関数をapply()の引数に渡す。
デフォルトでは各列に対して適用され、引数axis=1とすると各行に対して適用される。
f_maxmin = lambda x: max(x) - min(x)
print(df.apply(f_maxmin))

print(df.apply(f_maxmin, axis=1))
a    20
b    20
c    20
d    20
dtype: int64
0    3
1    3
2    3
dtype: int64
実装例(応用)
文字列がたのデータに対し、「%」をなくし、float型に変換する。
df["Bounce Rate"] = df["Bounce Rate"].astype(str).apply(lambda x: x.replace('%', '')).astype(float)
データを行・列(縦・横)方向にずらす: shift()
import pandas as pd

df = pd.DataFrame({'a': range(1, 6),
                   'b': [x**2 for x in range(1, 6)],
                   'c': [x**3 for x in range(1, 6)]})

print(df)
#    a   b    c
# 0  1   1    1
# 1  2   4    8
# 2  3   9   27
# 3  4  16   64
# 4  5  25  125
デフォルトでは下方向に1行ずれる。
print(df.shift())
#      a     b     c
# 0  NaN   NaN   NaN
# 1  1.0   1.0   1.0
# 2  2.0   4.0   8.0
# 3  3.0   9.0  27.0
# 4  4.0  16.0  64.0
負の値の場合は上方向にずれる
print(df.shift(-1))
#      a     b      c
# 0  2.0   4.0    8.0
# 1  3.0   9.0   27.0
# 2  4.0  16.0   64.0
# 3  5.0  25.0  125.0
# 4  NaN   NaN    NaN
データサイズの測り方
shape()
shapeでデータのサイズを測ることができる。
引数なしではデータセット全体の行数と列数を、
引数に0を指定すると行数、1を指定すると列数を数える。
import pandas as pd

sample = pd.DataFrame({'A':[1,2],
                       'B':[3,4],
                       'C':[5,6]})

# 以下のようなデータフレーム
#   A B C
# 0 1 3 5
# 1 2 4 6

sample.shape     # 全ての行と列の数を数える → (2,3)
sample.shape[0]  # 0番目の行数(インデックスの数)を数える → (2)
sample.shape[1]  # 列数を数える → (3)