この記事は?
先日
という記事を書きました。今回もヨーヨー & Matplotlib 関連の記事です 🪀
ヨーヨー界隈では、練習会や競技大会などのオフラインイベントが日本各地で開催されています。そして一般社団法人日本ヨーヨー連盟 (JYYF) という団体が以下のページでヨーヨーイベントの Google カレンダーを公開しています。
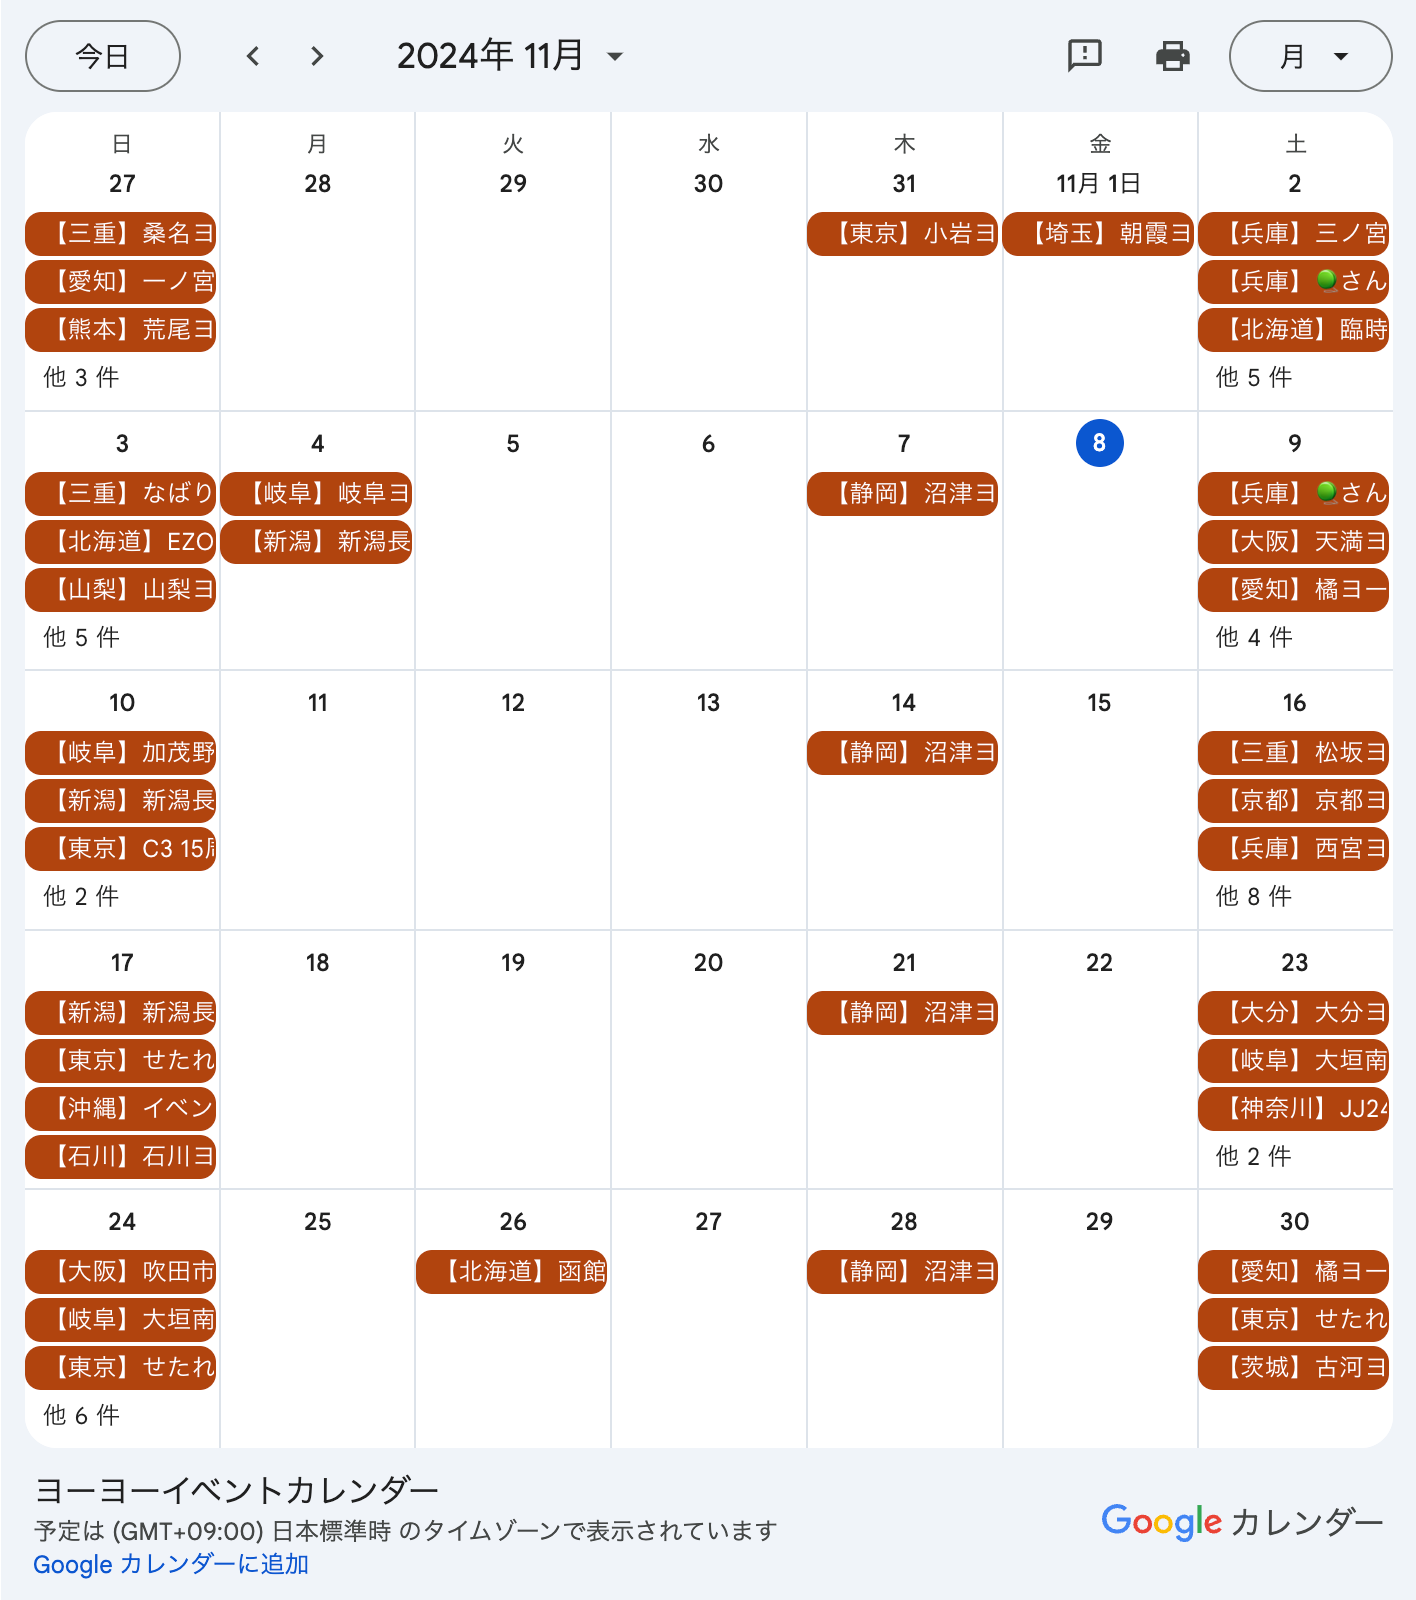
例えば 2024/11 のカレンダーはこんな感じです。
この Google カレンダーを参照すれば「どの都道府県でどれくらいの頻度でイベントが開催されているかを可視化できる」と考えました。今回は Python スクリプトを使用して可視化してみます。
バージョン情報
$ sw_vers
ProductName:		macOS
ProductVersion:		15.0.1
BuildVersion:		24A348

$ python --version
Python 3.13.0

$ pip list | grep \
  -e google-api-python-client -e google-auth-httplib2 -e google-auth-oauthlib \
  -e matplotlib -e japanmap -e pandas
google-api-python-client  2.151.0
google-auth-httplib2      0.2.0
google-auth-oauthlib      1.2.1
japanmap                  0.6.0
matplotlib                3.9.2
matplotlib-inline         0.1.7
pandas                    2.2.3
準備
Google Cloud サービスアカウント認証情報の取得
Python を使用して Google カレンダーの情報を API で取得するために Google Cloud のサービスアカウントの認証情報が必要です。この記事では具体的は方法を省略します。以下のページを参考に認証情報の JSON ファイルを取得し、後で記載する Python スクリプトと同じディレクトリに credentials.json として配置します。
必要なパッケージのインストール
Google カレンダーの API を呼び出したり日本地図を描画したりするためのパッケージをインストールします。まさに日本地図を描画するのにうってつけな japanmap というパッケージがあり、非常にありがたいです。
$ pip install \
  google-api-python-client google-auth-httplib2 google-auth-oauthlib \
  matplotlib japanmap pandas
日本地図の描画
以下の Python スクリプトを用意します。
import calendar
import datetime
import os
import re
from dateutil import tz
from google.auth import load_credentials_from_file
from googleapiclient.discovery import build
import japanmap
import matplotlib
import matplotlib.pyplot as plt
import pandas as pd

# Matplotlib のバックエンドに Agg (Anti-Grain Geometry) を使用する。
# 僕の環境で ModuleNotFoundError: No module named '_tkinter' というエラーを解決できないので
# 代替として。
matplotlib.use('Agg')

# Google Cload のサービスアカウントの認証情報 (JSON) を
# この Python スクリプトと同じディレクトリに credentials.json として配置しておく。
CREDENTIALS_PATH = os.path.join(os.path.dirname(os.path.abspath(__file__)), 'credentials.json')
# 一般社団法人日本ヨーヨー連盟 (JYYF) が
# https://www.jyyf.org/event-list でヨーヨーイベントの Google カレンダーを公開している。
# その Google カレンダーの ID。
CALENDAR_ID = '8fs9herksgoldqppsagpi3sm8c@group.calendar.google.com'
SCOPES = ['https://www.googleapis.com/auth/calendar.readonly']
# まれに、カレンダーのタイトルに都道府県名ではなく都市名が記載されている場合がある。
# その場合はこのマッピングを使って都道府県名に変換する。
# このマッピングは必要に応じて適宜追加していく。
PREFECTURE_NAME_MAPPING = {
    '盛岡': '岩手',
    '金沢': '石川',
    '横浜': '神奈川'
}


def build_service():
    credentials = load_credentials_from_file(CREDENTIALS_PATH, SCOPES)[0]
    service = build('calendar', 'v3', credentials=credentials)

    return service


def fetch_events(service, year, month):
    # スクリプト上では datetime を JST として扱いたいが、
    # Google カレンダーの API を呼び出す際は UTC に変換する必要がある。
    jst = tz.gettz('Asia/Tokyo')
    first_datetime_of_month = datetime.datetime(year, month, 1, 0, 0, 0, tzinfo=jst)
    days_in_month = calendar.monthrange(year, month)[1]
    last_datetime_of_month = datetime.datetime(year, month, days_in_month, 23, 59, 59, tzinfo=jst)

    events_result = service.events().list(
        calendarId=CALENDAR_ID,
        timeMin=first_datetime_of_month.astimezone(tz.UTC).isoformat(),
        timeMax=last_datetime_of_month.astimezone(tz.UTC).isoformat(),
        singleEvents=True,
        orderBy='startTime'
    ).execute()

    items = events_result.get('items', [])
    events = []
    for item in items:
        summary = item['summary']
        # summary は "【福岡】明太子ヨーヨー練習会" という形式になっている。
        # 正規表現を使って【】の部分から都道府県を抜き出す。
        match = re.search(r'【(.+?)】', summary)
        if match is None:
            continue
        city_or_prefecture = match.group(1)
        if city_or_prefecture in PREFECTURE_NAME_MAPPING:
            prefecture = PREFECTURE_NAME_MAPPING[city_or_prefecture]
        else:
            prefecture = city_or_prefecture
        if japanmap.pref_code(prefecture) == 0:
            print(f'{prefecture} は都道府県ではありません。無視します。')
            continue
        events.append((item['start']['date'], prefecture))

    return events


def fetch_all_events(service, year):
    events = []
    # 1 年という範囲では Google Calendar API の呼び出しがエラーになるので
    # 1 ヶ月単位で取得する。
    for month in range(1, 13):
        events += fetch_events(service=service, year=year, month=month)

    return events


if __name__ == '__main__':
    import sys

    # コマンドライン引数で年 (西暦) を受け取る。
    year = sys.argv[1]

    if re.match(r'^\d{4}$', year) is None:
        print(f'{year} is invalid as a western year.')
        sys.exit(1)

    service = build_service()
    # 2024 年のヨーヨーイベントを取得する。
    events = fetch_all_events(service=service, year=int(year))

    # events は (日付, 都道府県) という形式のタプルのリスト。
    # それを pandas の DataFrame に変換する。
    event_df = pd.DataFrame(events, columns=['Date', 'Prefecture'])
    # 都道府県ごとにイベントの数を集計する。
    count_df = event_df.groupby('Prefecture').count().reset_index()
    count_df.columns = ['Prefecture', 'Count']

    # イベントの数に応じて色付けする。数が多いほど濃い赤色になる。
    cmap = plt.get_cmap('Reds')
    norm = plt.Normalize(vmin=0, vmax=count_df.Count.max())
    count_df['Color'] = count_df.Count.apply(lambda x: f'#{bytes(cmap(norm(x), bytes=True)[:3]).hex()}')

    fig, ax = plt.subplots()
    fig.suptitle(year)

    # 日本地図に軸のラベルや目盛りは不要なので消す。
    ax.tick_params(left=False, bottom=False, labelleft=False, labelbottom=False)

    # 色付けされた日本地図にカラーバーを添えて描画する。
    picture = japanmap.picture(dict(zip(count_df.Prefecture, count_df.Color)))
    fig.colorbar(ax.imshow(picture, cmap=cmap, norm=norm))

    # 描画した地図を ~/Downloads/japanese_map_of_yoyo_events_{year}.png に出力する。
    fig.savefig(os.path.join(os.environ['HOME'], f'Downloads/japanese_map_of_yoyo_events_{year}.png'))
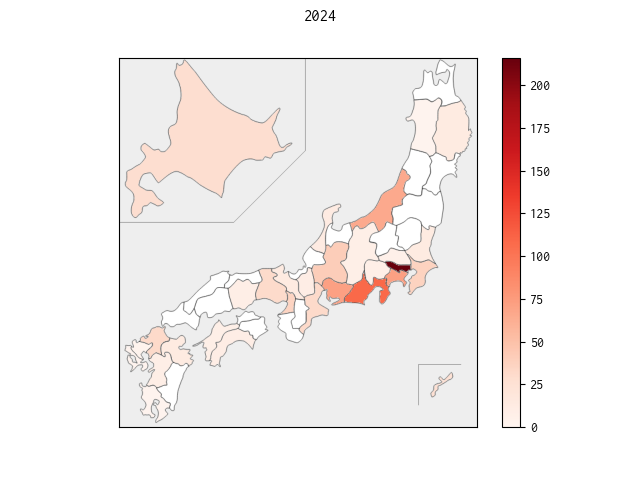
早速 Python スクリプトを実行してみましょう。そして出力された PNG ファイルを表示します。
$ python draw_japanese_map_of_yoyo_events.py 2024
$ open ~/Downloads/japanese_map_of_yoyo_events_2024.png
色付けされた日本地図が表示されましたね 🙌
人口が圧倒的に多い東京にイベントが集中するのは想像しやすいですが、静岡や新潟のイベントが多いのはちょっと意外ですよね。ヨーヨー界隈に詳しい方はなんとなく理由が分かるかもしれませんが。

