経緯
「プログラミング基礎」という授業題目で日本地図を4色で塗り分けるという課題が出されました.
ほんとに基礎か?
どちらかというと科目名は「アルゴリズムとデータ構造」寄りのことがメインな授業でした. AtCoder駆け出しの私「Union-Findで画像塗りつぶしできるんじゃね?」 という甘い考えのもと,[Flood-Fillアルゴリズム](https://en.wikipedia.org/wiki/Flood_fill)があることを知らずに Union-Find Treeで画像のピクセルを結合していくことになりました. ちなみにUnion-Findを用いる塗りつぶし解法は教員の想定解のうちの1つだったそうです.前提条件
課題で与えられた条件は
- 使用可能なライブラリは
sys及びPillow(PIL)のみ -
PILに実装されている塗りつぶしモジュールImageDraw.floodfillは使用不可
となっていた.本件のようにライブラリの使用制限がない場合は回れ右した方がいいかも![]()
はじめに
本記事では,地図の各閉領域は素集合であるという前提をもとに,
ということを行う.
4色定理に従わない隣接グラフを2番目で得てしまった場合は3番目で無限ループする.
前提知識
本記事では,以下のアルゴリズムとデータ構造を応用して4色問題を解く.
わからない内容については一度ここで最低限Wikipedia冒頭だけでも読んでいただけると理解が深まると思います.
- BFS(Breadth First Search)
- Wikipedia
- 応用元-Qiita@keisuke-otaさん
- Union-Find Tree
Pillow(PIL)のインストール
$ python3 -m pip install pillow
画像の前処理
2値化して白か黒かで閉領域かそれを成す枠線かを決める.
PILの基本的な使い方
from PIL import Image                        # モジュールのインポート

img = Image.open("input.png").convert("RGB") # 画像(input.png)を読み込み
width, height = img.size                     # 画像サイズの取得
r, g, b = img.getpixel((x, y))               # 座標(x, y)における色(r, g, b)を取得

new = Image.new("RGB", (width, height))      # 新しい空白の画像をサイズ(width, height)で作成
new.putpixel((x, y), (r, g, b))              # 座標(x, y)に色(r, g, b)を入れる
new.save("output.png")                       # 新しい画像(output.png)を出力
を踏まえた上で,色の値域0~255の半分となるようにRGBの平均が127を超えるか否かで黒か白に2値化する.
具体的には,
from PIL import Image

class Preprocess:
    def __init__(self, filename):
        self.img = Image.open(filename).convert("RGB")
        self.w, self.h = self.img.size

    def to_bin(self):
        self.bin_img = Image.new("RGB", (self.w, self.h))
        for y in range(self.h):
            for x in range(self.w):
                self.bin_img.putpixel(
                    (x, y),
                    (255, 255, 255) if sum(self.img.getpixel((x, y))) > 381 else (0, 0, 0)
                )
        return self

    def save(self, filename):
        self.bin_img.save(filename)

if __name__ == "__main__" :
    Preprocess("input_orig.png").to_bin().save("input.png")
とやれば元の画像input_orig.pngをマトモに扱える画像input.pngにすることができる.
実装
これより,「はじめに」で示した実装を進める.
2次元 Union-Find Treeの実装
いかたこのたこつぼさんの実装を2次元に拡張.もっといい実装あるかも.
class UnionFind:
    def __init__(self, n, m):
        self.table = [[(-1, -1)] * n for _ in range(m)]

    def root(self, p):
        x, y = p
        stack = list()
        tbl = self.table
        while tbl[y][x] >= (0, 0):
            stack.append((x, y))
            x, y = tbl[y][x]
        for _x, _y in stack:
            tbl[_y][_x] = (x, y)
        return (x, y)

    def find(self, p1, p2):
        return self.root(p1) == self.root(p2)

    def union(self, p1, p2):
        x1, y1 = self.root(p1)
        x2, y2 = self.root(p2)
        if x1 == x2 and y1 == y2:
            return

        d1 = self.table[y1][x1]
        d2 = self.table[y2][x2]
        if d1 <= d2:
            self.table[y2][x2] = (x1, y1)
            if d1 == d2:
                self.table[y1][x1] = (self.table[y1][x1][0] - 1, self.table[y1][x1][1] - 1)
        else:
            self.table[y1][x1] = (x2, y2)
画像から区切られた領域を抽出する
画像を左上から順に走査,Image.getpixel((x, y))でアクセスしている
座標(x, y)の右側(x, y + 1)と下側(x + 1, y)に対してそれぞれUnionFindの
Union((x, y), (x, y + 1)),Union((x, y), (x + 1, y))クエリを実行することを基本とする.
ただし,黒色のピクセルであれば閉領域のフレームであることを記録してUnionクエリは実行しない(continueする).
次のグラフにおいて,(x, y) = (1, 1)のときに(2, 1)と(1, 2)に対してUnionクエリを実行したイメージを示す.

from PIL import Image

img = Image.open("input.png").convert("RGB")
w, h = img.size
uf = UnionFind(w, h)
frame = set()
fw = 5

def product(a, b):
    return [(_a, _b) for _a in a for _b in b]

from y, x in product(range(h - 1), range(w - 1)):
    if img.getpixel((x, y)) == (0, 0, 0):
        frame.add((x, y))
        continue
    for _x, _y in zip([[x, x + 1], [y + 1, y]]):
        if img.getpixel((x, y)) == img.getpixel((_x, _y)):
            uf.union((x, y), (_x, _y))
ちなみに,productはいちいち定義しなくても
from itertools import product
とすれば使えるが,題意より今回は定義した.
閉領域が隣接しているかを判定し,隣接グラフを構成する
扱っている地図画像の枠線(各都道府県を区切る黒い線)の幅をfw(frame width)とする.
次の過程における4色問題を解くコードが無限ループしたら,おそらくこのfwが大きかったり小さかったりすることに起因していることに注意されたい.色々いじってみてうまく動く値を探して欲しい.
画像を左上から順に走査,座標(x, y)が閉領域のフレームでなければ,
Find((x, y), (x, y + fw)),Find((x, y), (x + fw, y))を行う.
ここで,Falseが返ってきたら,隣接している他の領域であることを意味するから,隣接グラフとして構成する.
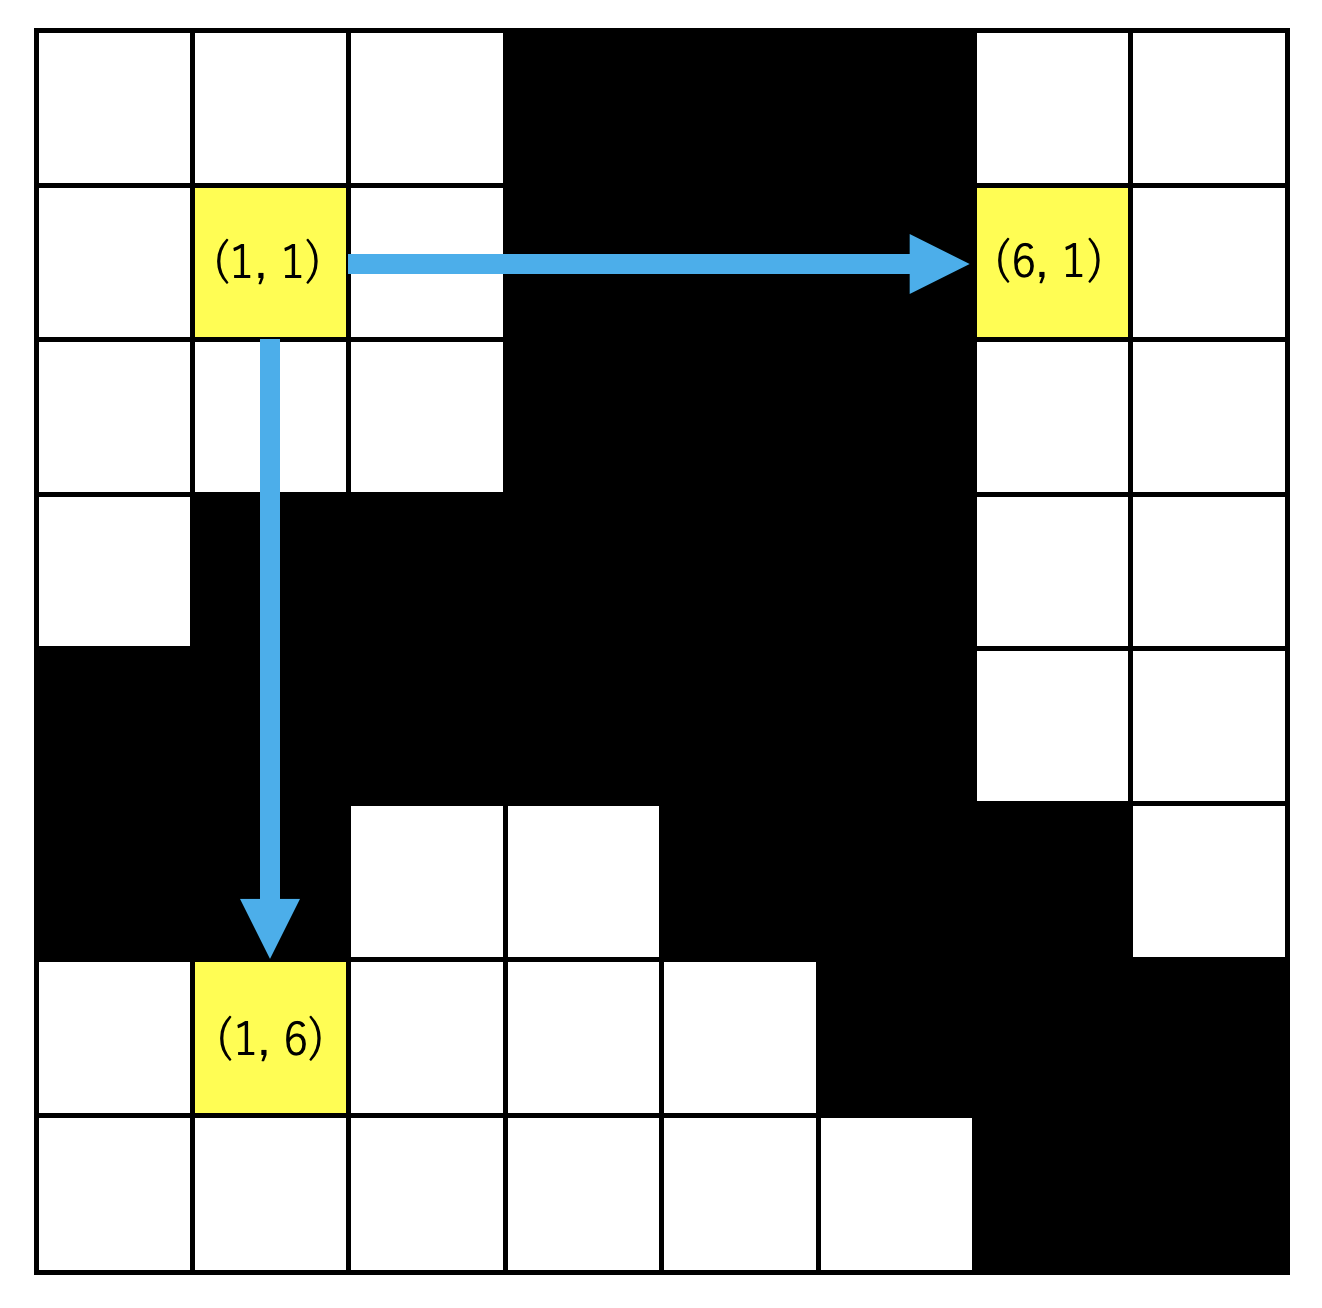
次のグラフにおいて(x, y) = (1, 1)のときに枠線をうまく跨ぐことができるようにfw = 5としてFindクエリを実行した場合のイメージを示す.
dgraph = dict()
for y, x in product(range(h - fw), range(w - fw)):
    if (x, y) in frame or (x, y + self.fw) in frame or (x + fw, y) in frame:
        continue
    for _x, _y in zip([x, x + fw], [y + fw, y]):
        if not uf.find((x, y), (_x, _y)):
            rx, ry = uf.root((x, y))
            dgraph.setdefault((rx, ry), set())
            dgraph[(rx, ry)].add(uf.root((_x, _y)))

# グラフの向きを双方向にする
# まず,ノードの種類を記録
nodes = set()
for key, value in dgraph.items():
    nodes.add(key)
    for v in value:
        nodes.add(v)

# あるノード"n"を参照するような他のノード"key"があれば,その"key"を"n"から参照する
# すなわち,グラフ key → n があれば n → key も作る.
for n in nodes:
    dgraph.setdefault(n, set())
    for key, value in dgraph.items():
        if key == n:
            continue
        if n in value:
            dgraph[n].add(key)
4色問題を解く
BFSによるゴリ押し.ノードの色を変更してみて,
- スコアが悪化しなければ変更して隣接ノードをQueueに追加.
- スコアが悪化するのであれば変更する前の色に戻す.
とした.また,その過程でQueueの中身が尽きてしまうこともあるので,その場合には全部のノードを追加した.
教員の想定解は充足可能性問題を解くプログラムであった.
class Queue:
    def __init__(self, data = []):
        self.data = data
        self.lightly = set()

    def append(self, x):
        if x in self.lightly:
            return self.data
        else:
            self.data.append(x)
            self.lightly.add(x)
        return self.data

    def popleft(self):
        cell = self.data[0]
        self.lightly.discard(cell)
        del self.data[0]
        return cell

class Node:
    def __init__(self, point, nears):
        self.point = point
        self.nears = nears
        self.color = 0

# グラフ全体のスコア. 最大値が0. 隣接しているノードと同じ色を持ってしまったら減点.
def score(graph, nodes):
    s = 0
    for key, value in graph.items():
        for v in value:
            if nodes[key].color == nodes[v].color:
                s -= 1
    return s

nodes = dict()
for key, value in graph.items():
    nodes[key] = Node(key, value)

nc = 4 # The number of color is FOUR. 4色問題なので.

queue = Queue()
for k in nodes.keys():
    queue.append(nodes[k])

before = -1e8
after = -1e8
while after != 0:
    node = queue.popleft()
    befcolor = node.color
    before = score(graph, nodes)
    for _ in range(nc - 1):
        nodes[node.point].color = (nodes[node.point].color + 1) % nc
        after = score(graph, nodes)
        if before <= after:
            break
    if before <= after:
        for near in node.nears:
            queue.append(nodes[near])
    else:
        nodes[node.point].color = befcolor

    if not queue.data and after != 0:
        for k in nodes.keys():
            queue.append(self.nodes[k])

ans = {v.point: v.color for v in self.nodes.values()}
ちなみに,今回も題意よりQueueを定義しているが,
from collections import deque
でもっと汎用性のあるQueueを使うことができる.
今回定義したQueueは,同じ要素を含まないよう改造していることに注意されたい.
ノードに対応する閉領域を塗りつぶす
UnionFind.root((x, y))で色が割り振られたノードにたどり着くはず.
周囲が黒であったためか,色が割り振られていないノードもあった.要デバッグ.
応急的処置としてcolors.get(UnionFind.root((x, y)), 0)としておき,colorsを参照してもkeyがない場合にはデフォルト値である0を適用させた.この場合指定される色はcolorの0番目である赤になる.
color = [(255, 0, 0), (0, 0, 255), (0, 255, 0), (255, 0, 255)]
new = Image.new("RGB", (w, h))
for y, x in product(range(h - 1), range(w - 1)):
    if (x, y) in frame:
        new.putpixel((x, y), (0, 0, 0))
        continue
    else:
        new.putpixel(
            (x, y),
            self.color[colors.get(uf.root((x, y)), 0)]
        )
new.save("output.png")
全部まとめたコード
from PIL import Image
import sys

def product(x, y):
    return [(_x, _y) for _x in x for _y in y]

class UnionFind:
    def __init__(self, n, m):
        self.table = [[(-1, -1)] * n for _ in range(m)]

    def root(self, p):
        x, y = p
        stack = list()
        tbl = self.table
        while tbl[y][x] >= (0, 0):
            stack.append((x, y))
            x, y = tbl[y][x]
        for _x, _y in stack:
            tbl[_y][_x] = (x, y)
        return (x, y)

    def find(self, p1, p2):
        return self.root(p1) == self.root(p2)

    def union(self, p1, p2):
        x1, y1 = self.root(p1)
        x2, y2 = self.root(p2)
        if x1 == x2 and y1 == y2:
            return

        d1 = self.table[y1][x1]
        d2 = self.table[y2][x2]
        if d1 <= d2:
            self.table[y2][x2] = (x1, y1)
            if d1 == d2:
                self.table[y1][x1] = (self.table[y1][x1][0] - 1, self.table[y1][x1][1] - 1)
        else:
            self.table[y1][x1] = (x2, y2)

class ImageProcessing:
    def __init__(self, img):
        self.img = img
        self.w, self.h = self.img.size
        self.uf = UnionFind(self.w, self.h)
        self.dgraph = dict()
        self.frame = set()
        self.fw = 5 # Frame Wdith
        self.color = [(255, 0, 0), (0, 0, 255), (0, 255, 0), (255, 0, 255)]

    def classify(self):
        for y, x in product(range(self.h - 1), range(self.w - 1)):
            if self.img.getpixel((x, y)) == (0, 0, 0):
                self.frame.add((x, y))
                continue
            for _x, _y in zip([x, x + 1], [y + 1, y]):
                if self.img.getpixel((x, y)) == self.img.getpixel((_x, _y)):
                    self.uf.union((x, y), (_x, _y))

            if x == 0:
                prg = 25 * y // self.h
                print("\r [{0}] {1:3}%".format("#" * prg + " " * (50 - prg), prg * 2), end="")

    def paint(self, colors):
        new = Image.new("RGB", (self.w, self.h))
        for y, x in product(range(self.h - 1), range(self.w - 1)):
            if (x, y) in self.frame:
                new.putpixel((x, y), (0, 0, 0))
                continue
            new.putpixel((x, y),
                self.color[colors.get(self.uf.root((x, y)), 0)]
            )
            if x == 0:
                prg = 10 * y // self.h + 40
                print("\r [{0}] {1:3}%".format("#" * prg + " " * (50 - prg), prg * 2), end="")
        new.save("a.png")
        print("\r [{0}] {1}%".format("#" * 50, 100))

    def graph(self):
        for y, x in product(range(self.h - self.fw), range(self.w - self.fw)):
            if (x, y) in self.frame or (x, y + self.fw) in self.frame or (x + self.fw, y) in self.frame:
                continue

            for _x, _y in zip([x, x + self.fw], [y + self.fw, y]):
                if not self.uf.find((x, y), (_x, _y)):
                    rx, ry = self.uf.root((x, y))
                    self.dgraph.setdefault((rx, ry), set())
                    self.dgraph[(rx, ry)].add(self.uf.root((_x, _y)))

            if x == 0:
                prg = 15 * y // self.h + 25
                print("\r [{0}] {1:3}%".format("#" * prg + " " * (50 - prg), prg * 2), end="")

        points = set()
        for key, value in self.dgraph.items():
            points.add(key)
            for v in value:
                points.add(v)

        for p in points:
            self.dgraph.setdefault(p, set())
            for key, value in self.dgraph.items():
                if key == p:
                    continue
                if p in value:
                    self.dgraph[p].add(key)

class Queue:
    def __init__(self, data = []):
        self.data = data
        self.lightly = set()

    def append(self, x):
        if x in self.lightly:
            return self.data
        else:
            self.data.append(x)
            self.lightly.add(x)
        return self.data

    def popleft(self):
        cell = self.data[0]
        self.lightly.discard(cell)
        del self.data[0]
        return cell

class Node:
    def __init__(self, point, nears):
        self.point = point
        self.nears = nears
        self.color = 0

    def __repr__(self):
        return f'Node index{self.point} nears:{self.nears} sign:{self.color}'

class Solver:
    def __init__(self, graph):
        self.graph = graph
        self.nodes = dict()
        self.nc = 4
        for key, value in graph.items():
            self.nodes[key] = Node(key, value)

    def score(self):
        s = 0
        for key, value in self.graph.items():
            for v in value:
                if self.nodes[key].color == self.nodes[v].color:
                    s -= 1
        return s

    def solve(self):
        queue = Queue()
        for k in self.nodes.keys():
            queue.append(self.nodes[k])

        before, after = -1e8, -1e8
        while after != 0:
            node = queue.popleft()
            befcolor = node.color
            before = self.score()
            for i in range(self.nc - 1):
                self.nodes[node.point].color = (self.nodes[node.point].color + 1) % self.nc
                after = self.score()
                if before <= after:
                    break
            if before <= after:
                for near in node.nears:
                    queue.append(self.nodes[near])
            else:
                self.nodes[node.point].color = befcolor

            if not queue.data and after != 0:
                for k in self.nodes.keys():
                    queue.append(self.nodes[k])

        return {v.point: v.color for v in self.nodes.values()}

if __name__ == "__main__":
    if len(sys.argv) < 2:
        print("You will need to execute with filename")
        sys.exit(-1)
    ip = ImageProcessing(Image.open(sys.argv[1]).convert("RGB"))
    ip.classify()
    ip.graph()
    solver = Solver(ip.dgraph)
    ip.paint(solver.solve())
使い方
上記の全部まとめたコードをmain.pyで保存して,入力とする画像をinput.pngとすれば
$ python3 main.py input.png
で実行できる.
出力されるファイルはa.outになる.
計算量
Union-Find Treeにおける各クエリの計算量は$\alpha(n)$である.
ここで,関数$\alpha(n)$はアッカーマン関数$Ack(n)$の逆関数である.
アッカーマン関数は急増加関数で,その逆関数たる$\alpha(n)$はほとんど定数とみなして良い.
画像の縦横のピクセル数をそれぞれ横$W$,縦$H$とすれば$O(WH\cdot\alpha(WH))$となる.
最初の閉領域抽出の際は,Unionクエリで根へのショートカット動作のためか全体の実行時間のうち半分以上を占めた.
次の連結グラフ生成の際には,Findクエリで先程のような動作はないため,全体の実行時間のうち1/4を占めた.
それに対して4色問題を解く部分は全体の1/50にも満たない時間で終了した.
最後の塗りつぶし動作では,rootの動作が1つだけで良い(UnionやFindはrootが2つある)ので,
連結グラフ生成の時間の半分に加えて画像出力に係る処理時間を要した.
入出力例
このWikipedia Commonsの日本地図に対して実行してみる.

結果は,

4色に塗り分けられることとなった.
おわりに
NetworkXを用いてグラフを可視化したくて,辞書型でdgraphなんてやつを作っているけど
可視化の必要がない今はnodesだけでいいかも.
近いうちに,nodesだけで構成できるように変更をします.