はじめに

6号機の「はーです」でましたね!
私はAT中が好きでちょいちょい打っています。
で、この台は「右上がり黄七」の出現に設定差がかなりあるのですが、
何回転ぐらいで、判別できるかプログラムで試してみたいと思います。

なお、設定が偶数か奇数かは、他の要素で何となく推測できているものとして、奇遇に分けて調査してみました。
プロット
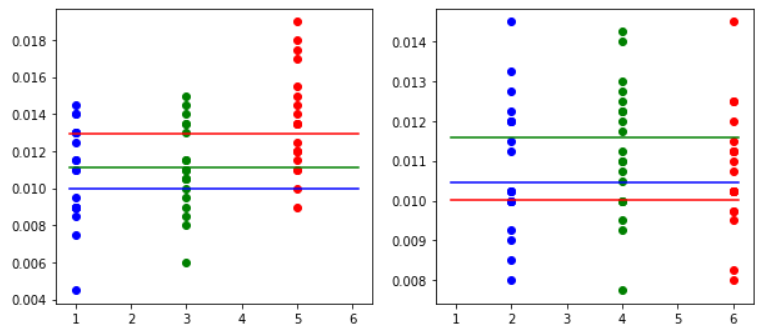
設定1,3,5と2,4,6に分けて2000, 4000, 6000, 8000回転を20回ずつ実行してみました。
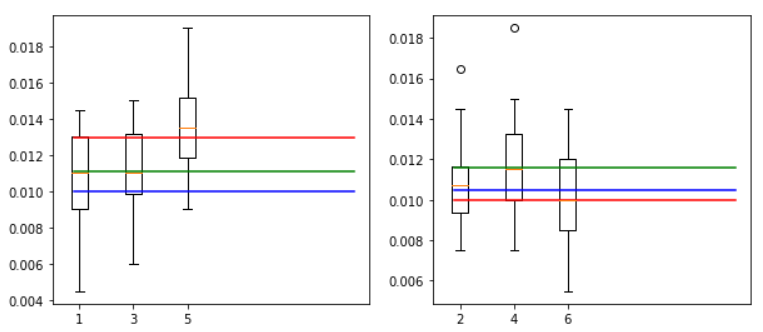
奇数は(1,3) or 5なら2000回転で判別できそうな感じがします。
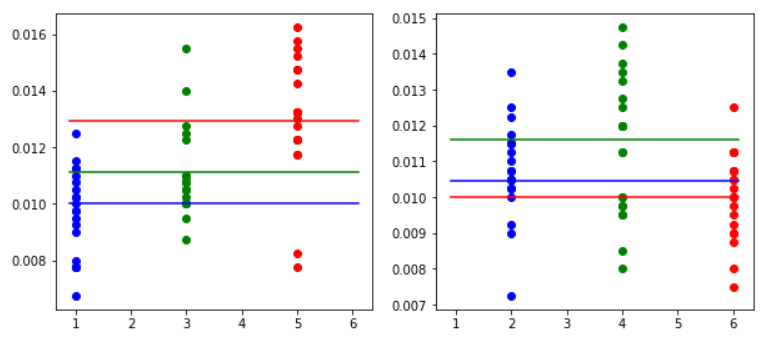
偶数は(2,6) or 4なら4000回転で判別できそうな感じがします。
2000回転(左奇数、右偶数)
4000回転(左奇数、右偶数)
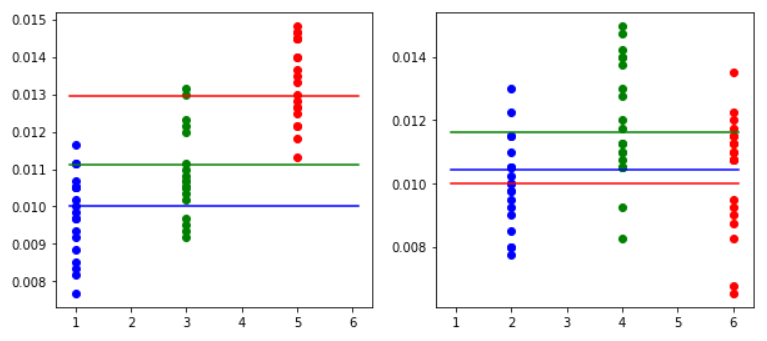
6000回転(左奇数、右偶数)
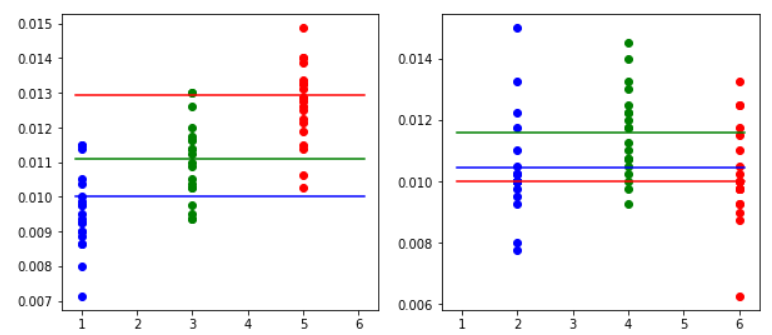
8000回転(左奇数、右偶数)
箱ひげ図
2000回転(左奇数、右偶数)
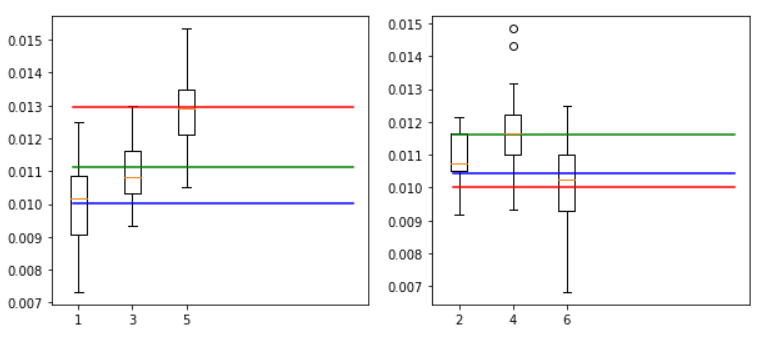
4000回転(左奇数、右偶数)

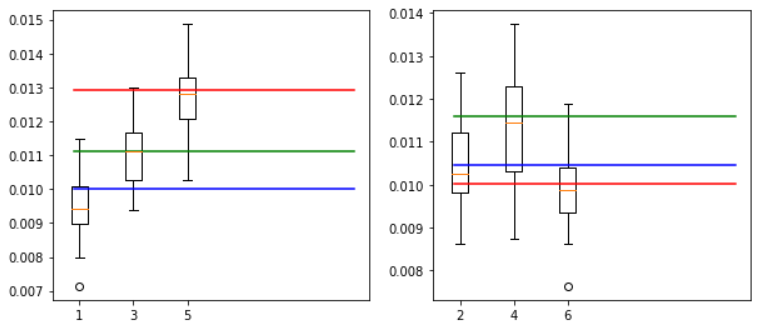
6000回転(左奇数、右偶数)
8000回転(左奇数、右偶数)
ソース
すいません、python勉強中なので、へたくそです。orz
# 必要なものをインポート
import numpy as np
import matplotlib.pyplot as plt
import math

# 乱数を固定
np.random.seed(10)

# 試行回数
T = 20

# 回数数
N = 4000

# 設定別「右上がり黄7発生確率」
PROP = np.array([ 1 / 99.9, 1 / 95.7, 1/ 90.0, 1 / 86.2, 1 / 77.3, 1 / 99.9 ])
COLORS = ['blue', 'green', 'red']

odds = [0, 2, 4]
evens = [1, 3, 5]

fig, axes = plt.subplots(nrows=8, ncols=2, figsize=(10,40), sharex=False)

for i, n in enumerate([2000, 4000, 6000, 8000]):
    for even in [0, 1]:
        if even == 0:
            temp = odds
        else:
            temp = evens
        # plot
        yarray = []
        for j, s in enumerate(temp):
            x = np.full(T, s + 1)
            y = done(n, T, PROP[s])
            yarray.append(y)
            axes[i,even].scatter(x, y, color=COLORS[j])
            x = np.array([0.9, 6.1])
            y = np.full(2, PROP[s])
            axes[i,even].plot(x, y, color=COLORS[j])

        # 箱ひげ図
        axes[i + 4,even].boxplot(yarray)
        if even == 0:
            axes[i + 4,even].set_xticklabels(['1', '3', '5'])
        else:
            axes[i + 4,even].set_xticklabels(['2', '4', '6'])

        for j, s in enumerate(temp):
            x = np.array([0.9, 6.1])
            y = np.full(2, PROP[s])
            axes[i + 4,even].plot(x, y, color=COLORS[j])


def done(N, t, p):
    ret = np.array([])
    for n in range(t): # t回試行
        a = np.random.rand(N)  # N回転する
        ret = np.append(ret, len(np.where(a < p)[0]) / N)
    return ret
最後に
個人的には、「右上がり黄7」で判別するより、「チャンスゾーンからのゴッドラッシュ当選確率」を見たほうが良いように思う。