前回に続いて、Matplotlibでリアルタイムグラフを描写させますが、目視必要ないラインを表示させたくない事もあり表示ラインを選択できるようにプログラムを修正してみました。
Matplotlibラインの非表示
ラインに対して、set_visible を使い(True / False)で表示非表示を切り替えられるのがわかりました。
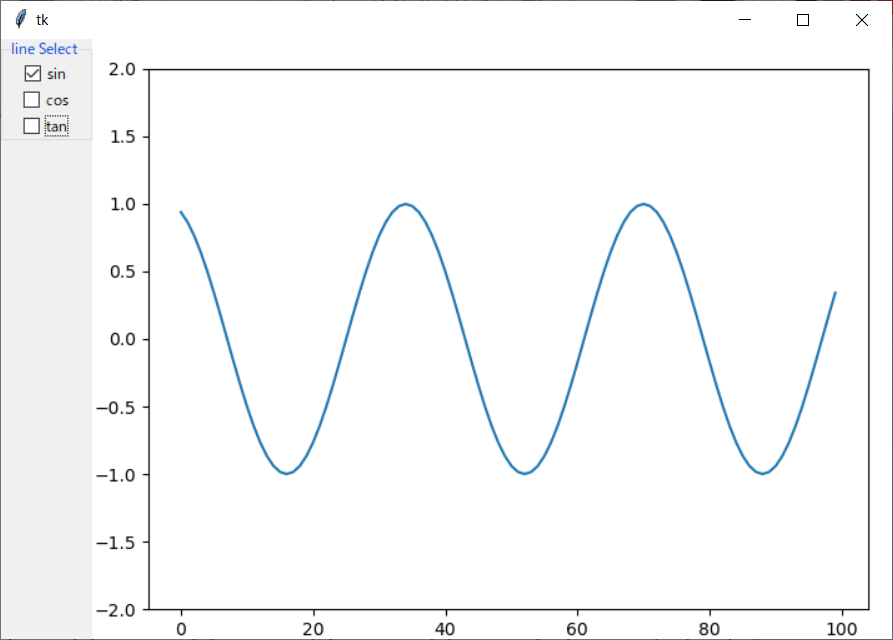
動作イメージ
左側にlineを選択できるチェックボックスを作ってみました
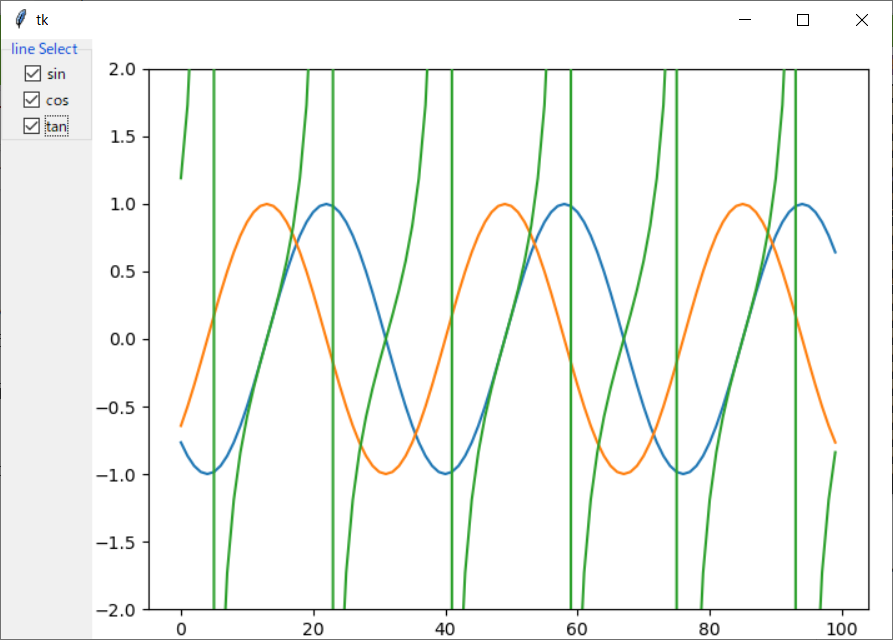
チェックボックスを外すとそのライン消えます
ソースコード
SelectableGraph.py
import numpy as np
import tkinter as tk
import tkinter.ttk as ttk
import math

from matplotlib.backends.backend_tkagg import (
    FigureCanvasTkAgg, NavigationToolbar2Tk)
from matplotlib.figure import Figure
import matplotlib.animation as animation

class GraphFrame(ttk.Frame):
    def __init__(self, master, graph_num):
        super().__init__(master)
        #Graph view
        fig = Figure()
        canvas = FigureCanvasTkAgg(fig, master=master)
        self.x = np.arange(0, 10, 0.1)
        self.y_datas = []
        for y in range(graph_num):
            self.y_datas.append( np.zeros(100) )
        l = np.arange(0, 10, 0.01)
        plt = fig.add_subplot(111)
        plt.set_ylim([-2, 2])
        plt.set_position([0.07, 0.05, 0.9, 0.9])
        self.lines = []
        for y in range(graph_num):
            yp, = plt.plot(self.y_datas[y])
            self.lines.append( yp, )

        ani = animation.FuncAnimation(fig, self.animate, l,
                                      interval=20, blit=True,
        )
        canvas.get_tk_widget().pack()

    def animate(self, i):
        count = 0
        for line in self.lines:
            line.set_ydata(self.y_datas[count])
            count+=1
        return self.lines[0:]

    def setValues(self, vals):
        count = 0
        for val in vals:
            self.y_datas[count] = np.append(self.y_datas[count], val)
            self.y_datas[count] = np.delete(self.y_datas[count], 0)
            count+=1

    def visible(self, opts):
        count = 0
        for opt in opts:
            self.lines[count].set_visible(opt.get())
            count+=1

class SelectableGraph(ttk.Frame):
    def __init__(self, master, graph_list):
        super().__init__(master)
        self.pack()

        self.graph_num = len(graph_list)

        select_frame = ttk.LabelFrame(self, text= "line Select",relief = 'groove')
        select_frame.pack(side = 'left', anchor = tk.N)

        def on_check():
            self.gf.visible(opts)

        opts = [tk.BooleanVar() for _ in range(self.graph_num)]
        for item in opts:
            item.set(True)
        for i in range(self.graph_num):
            ttk.Checkbutton(select_frame, text = graph_list[i],
                            variable = opts[i], command=on_check).pack()

        graph_frame = ttk.Frame(self)
        self.gf =GraphFrame(graph_frame, self.graph_num)
        graph_frame.pack(side = 'right', fill = 'x')

    def setValues(self, vals):
        self.gf.setValues(vals)


class RealtimeUpdateGraph(ttk.Frame):
    def __init__(self, master):
        super().__init__(master)
        self.test_count = 0
        self.master = master

        #Selectable lines
        graph_list = ["sin", "cos", "tan"]
        graph_frame = ttk.Frame(master)
        self.gf =SelectableGraph(graph_frame, graph_list)
        graph_frame.pack(side = 'right', fill = 'x')

        self.update()

    def update(self):
        vals = []
        vals.append( math.sin(math.radians(10*self.test_count)))
        vals.append( math.cos(math.radians(10*self.test_count)))
        vals.append( math.tan(math.radians(10*self.test_count)))
        self.gf.setValues( vals )
        self.test_count+=1
        self.master.after(100, self.update)


if __name__ == "__main__":
    win = tk.Tk()
    gh = RealtimeUpdateGraph(win)
    win.mainloop()
こんなコード書かなくても、matplotlibに標準機能でグラフ表示をON/OFFできるかもしれません。
凡例ラベルにグラフ表示ON/OFFできる機能をご存じの方がいればアドバイス頂ければと思います。