概要
Illustratorを使っていたとき、雰囲気を出すために(??)方眼紙に描いたような指数関数グラフが欲しくなりました。適当な曲線で作るのは嫌だし、グラフツールはデータを用意しなければいけません。y = a^xぐらいデータを用意しなくとも一瞬で出してほしいところですが、ともかくMatplotlibの出番です。
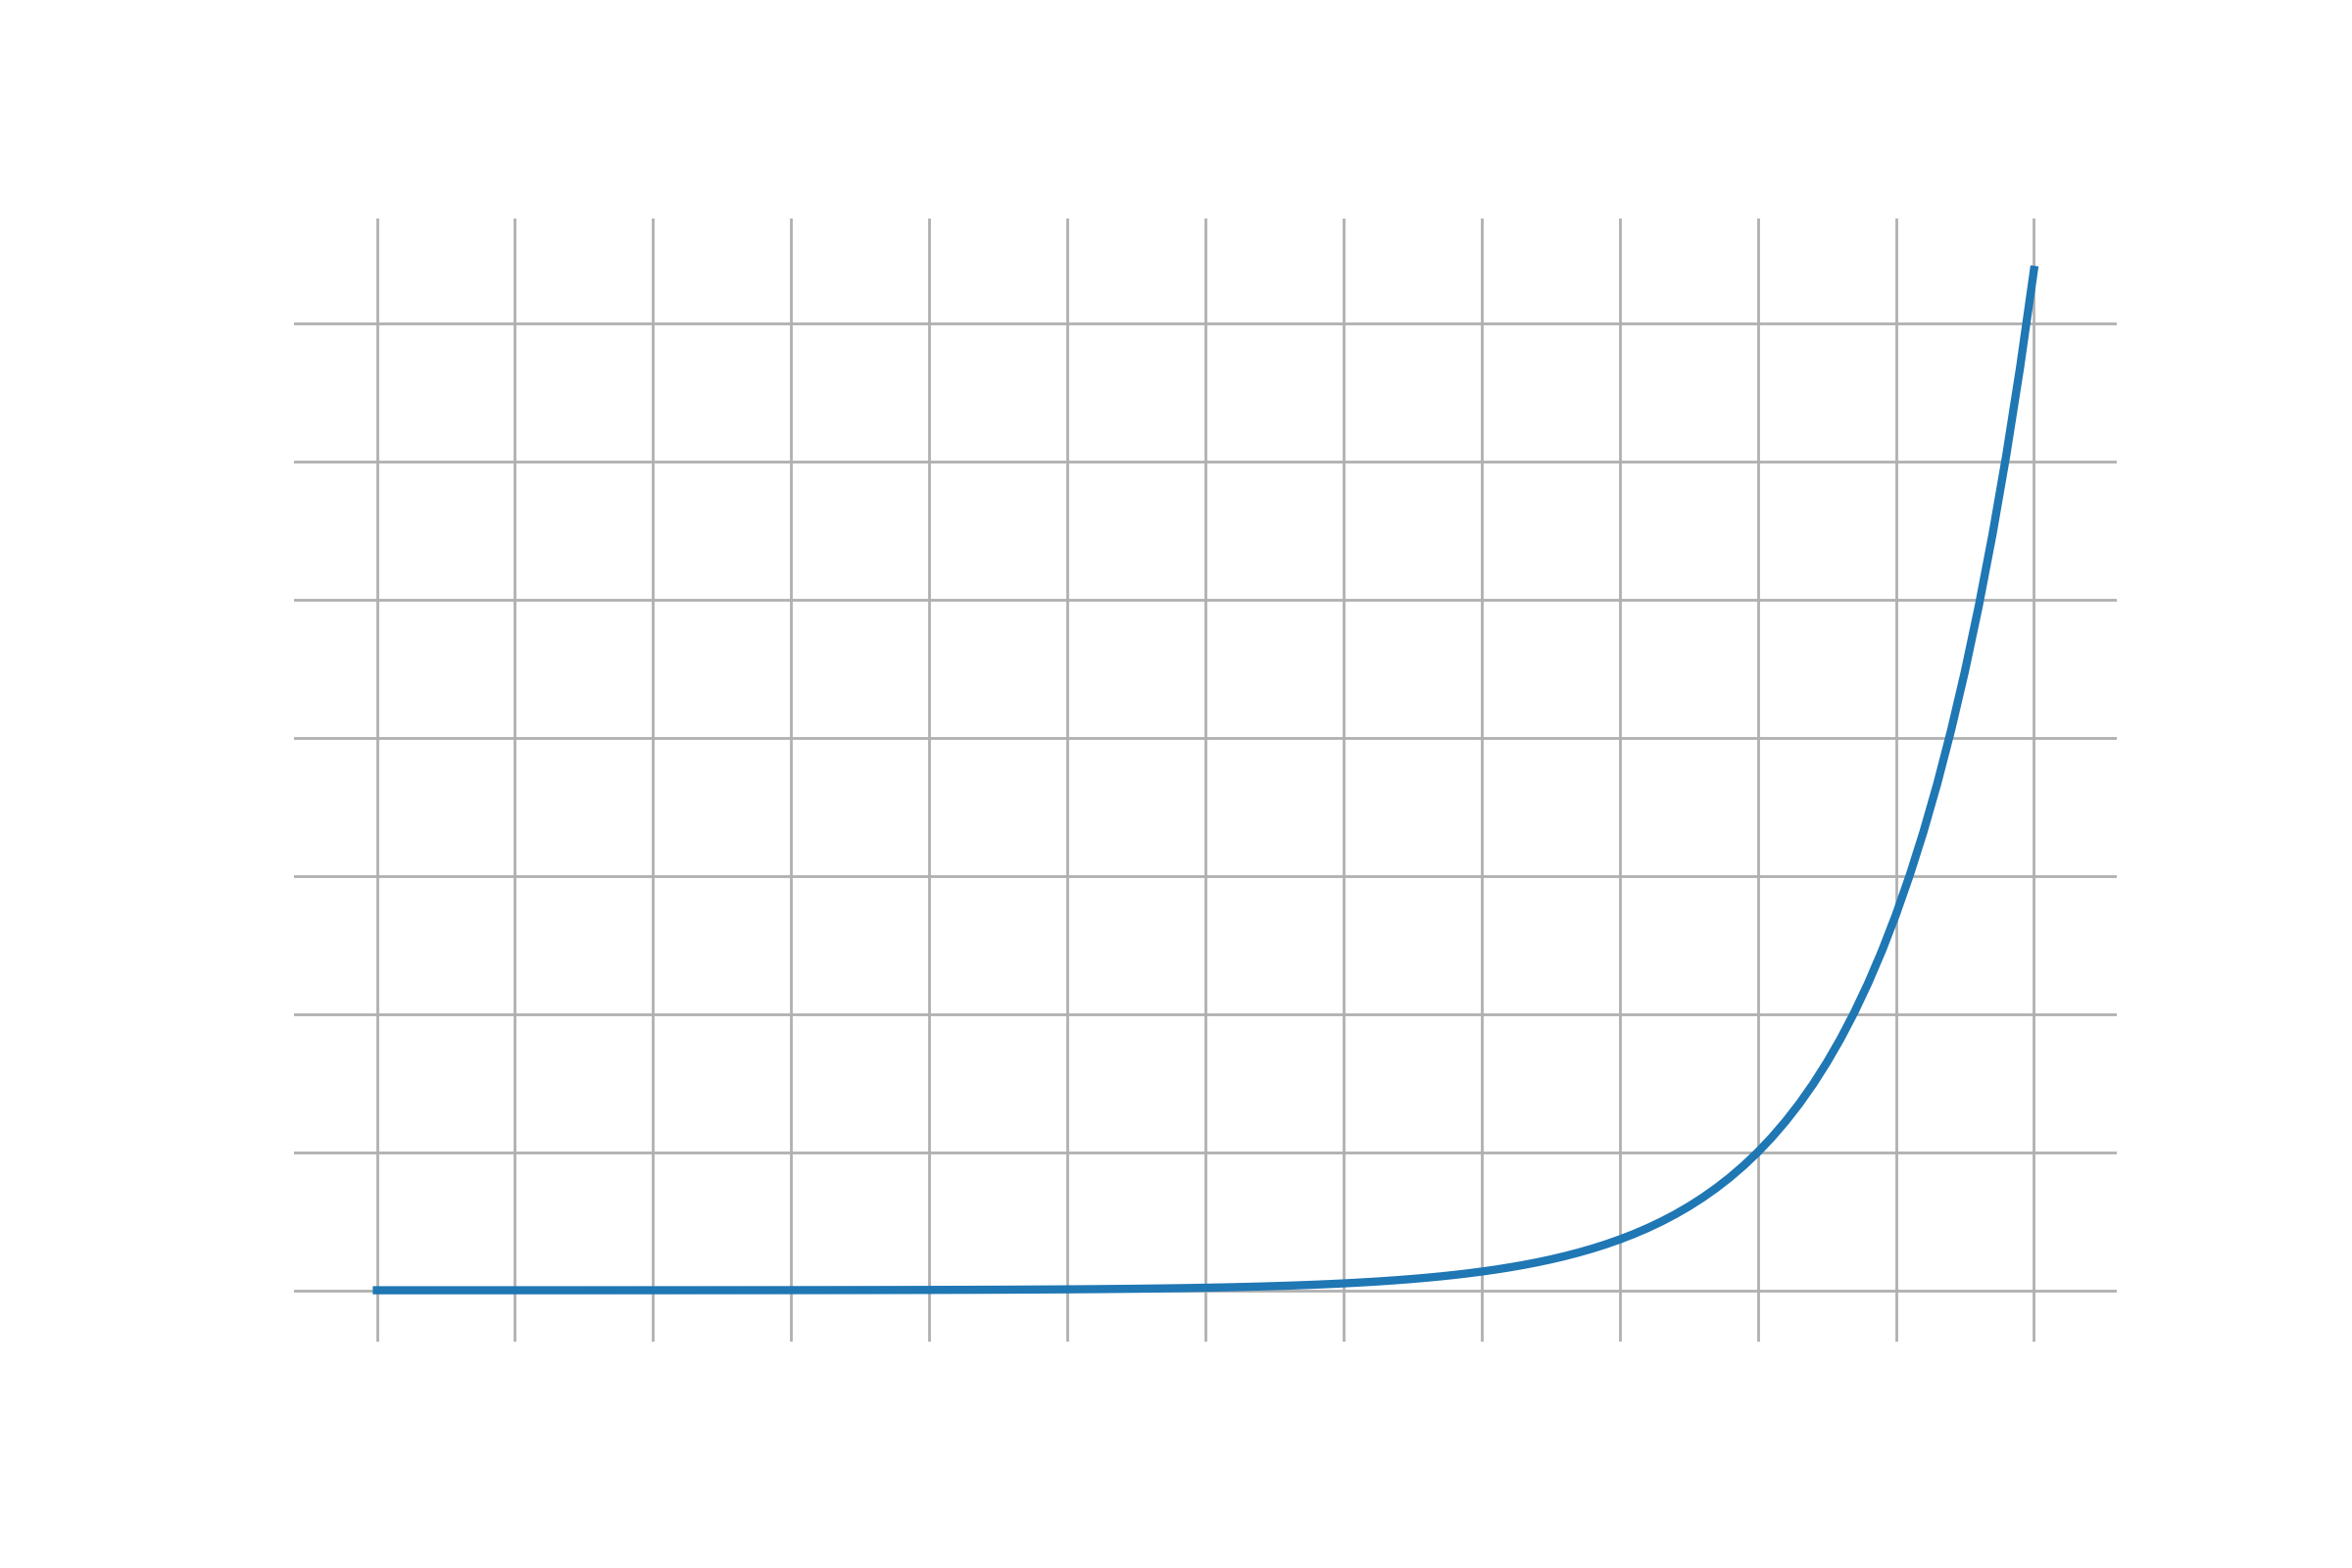
方眼紙スタイルにするために、x軸y軸を等スケールでプロット、外枠なし、目盛り数字なしで表示させました。この状態を実現するのに意外と多くの設定を必要としたので記録に残します。
出力例
 $ \qquad y = e^x \quad (-10 \leqq x \leqq 2) $
コード
import matplotlib.pyplot as plt
import numpy as np

x = np.arange(-10, 2.1, 0.1)
y = (np.e)**x

plt.plot(x, y)

# x軸とy軸を同じスケールで
plt.axis('scaled')

# 目盛りを刻む間隔を調整(1刻みならlist(range(...))で十分ですが、
# 対数目盛りにしたいときなどラムダ式をいじってください)
plt.xticks(list(map(lambda x: x, np.arange(-10,3))))
plt.yticks(list(map(lambda y: y, np.arange(0, 8))))

# グリッド表示
plt.grid(linewidth=0.5)

# 外枠をすべて非表示
plt.gca().spines['top'].set_visible(False)
plt.gca().spines['bottom'].set_visible(False)
plt.gca().spines['left'].set_visible(False)
plt.gca().spines['right'].set_visible(False)

# 目盛りの表示設定
plt.tick_params(
    axis='both',
    which='both',
    left=False,           #外枠目盛りを非表示
    bottom=False,
    labelleft=False,      #外枠目盛りの数字を非表示
    labelbottom=False
)

# 各形式で出力
plt.savefig("expgraph.png", format="png", dpi=400, transparent=True)
plt.savefig("expgraph.svg", format="svg", transparent=True)
plt.savefig("expgraph.eps", format="eps", transparent=True)
plt.savefig("expgraph.pdf", format="pdf", transparent=True)

plt.show()
リポジトリ