昨日、【ドルコスト平均法】オルカンなのかSP500なのか、NVIDIAはたまた国内株なのか、。。。よりリアルにNISAのゲインを追求する🎵を書いたが、外貨積立もドルコスト平均法で積立てる仕組みがあるので、今回は、それを同様にシミュレーションしてみる。
為替データは、以下の参考のとおりであるが、一部仕様が変わり、参考②のように変更が必要であった。
【参考】
①【シストレ入門】FXと株価時系列のシミュレータ作って遊んでみた♬
②pandas-datareaderでyahooファイナンスのデータを取得する方法
コード変更
Lib
import pandas as pd
import numpy as np
import matplotlib.pyplot as plt
import matplotlib.dates as mdates
import datetime as dt
from pandas_datareader import data
import yfinance as yf

import statsmodels.api as sm
from statsmodels.tsa.seasonal import STL
fxデータの取得検証は、以下のとおりで、動いたので昨日のコードと合わせるとfxデータでのドルコスト平均法のシミュレーションのプログラムができる。
import pandas_datareader.data as DataReader

yf.pdr_override() #これが必要になった;
# 参考; https://knowledge-bridge.info/technology/statistics/3654/

start = dt.date(2019,1,1)
end = dt.date(2021,3,18)

stock0= 'GBPJPY=X'
df=DataReader.get_data_yahoo("{}".format(stock0),start,end)
df
したがって、取得関数を以下のように定義する。
def get_fx_yf(stock,start,end):
    df = DataReader.get_data_yahoo("{}".format(stock0),start,end)
    return df
getfx.pyを利用
start = '2004-04-01'
end = '2024-03-31'
stock = 'GBPJPY=X'
df = pd.DataFrame(get_fx_yf(stock, start, end))
df['Close']
取引日定義
df['date'] = df.index
投資日定義
昨日のコードと同様に投資日をdf_dateに設定する。
※今回は月一投資とする。実際は週次や日次もできそうである。
df_date = pd.DataFrame()
d_series = df['date']
target_dates = '20'
date_list = []
for k in ('04','05','06','07','08','09','10','11','12','13','14','15','16','17','18','19','20','21','22','23','24'):
    target_date = target_dates + k +'-'

    for j in ('01','02','03','04','05','06','07','08','09','10','11','12'):
        target_date_ = target_date + j
        for i in ("01","02","03","04","05","06","07"):
            target_date2 = target_date_ + '-' + i
            exists = (d_series == target_date2).any()
            #print(target_date2, exists)
            if(exists == True):
                date_list.append(target_date2)
                break
df_date = date_list
投資する
yosan0 = 33000
def yosan_make(market, price_ave):
    yosan = yosan0 #毎月投資額 33,000円 price_aveで変更可
    return yosan

pd_stock = pd.DataFrame()

def market_history(df):
    i_list = []
    cost_list = []
    kutisu_list = []
    kutisu_sum_list = []
    kutisu_sum = 0
    cost_sum_list = []
    cost_sum = 0
    price_sum = 0
    price = 0
    mean_price_list = []
    heikin_cost_list = []
    price_list = []
    j = 0
    for i in df_date:
        price = df['Close'][i]
        price_list.append(price)

        i_list.append(i)
        price_sum += df['Close'][i]
        price_ave = price_sum/(j+1)
        mean_price_list.append(price_ave)
        yosan = yosan_make(df['Close'][i], price_ave)
        cost_list.append(yosan)
        cost_sum += yosan
        cost_sum_list.append(cost_sum)
        kutisu = yosan/df['Close'][i]
        kutisu_list.append(kutisu)
        kutisu_sum +=kutisu
        kutisu_sum_list.append(kutisu_sum)
        heikin_cost_list.append(cost_sum/kutisu_sum)
        j +=1

    pd_stock['date'] = i_list
    pd_stock['price'] = price_list
    pd_stock['mean_price'] = mean_price_list
    pd_stock['kutisu'] = kutisu_list #yosan/df['Close']
    pd_stock['cost'] = cost_list
    pd_stock['cost_sum'] = cost_sum_list
    pd_stock['kutisu_sum'] = kutisu_sum_list
    pd_stock['jika'] = pd_stock['price']*pd_stock['kutisu_sum']
    pd_stock['heikin_cost'] = heikin_cost_list
    return pd_stock

pd_stock = market_history(df)
pd_stock
出力
	date	price	mean_price	kutisu	cost	cost_sum	kutisu_sum	jika	heikin_cost
0	2004-04-01	192.559998	192.559998	171.375158	33000	33000	171.375158	3.300000e+04	192.559998
1	2004-05-03	195.070007	193.815002	169.170035	33000	66000	340.545193	6.643015e+04	193.806876
2	2004-06-01	203.199997	196.943334	162.401577	33000	99000	502.946770	1.021988e+05	196.839916
3	2004-07-01	197.380005	197.052502	167.190187	33000	132000	670.136958	1.322716e+05	196.974661
4	2004-08-02	202.130005	198.068002	163.261264	33000	165000	833.398221	1.684548e+05	197.984584
...	...	...	...	...	...	...	...	...	...
235	2023-11-01	183.835007	164.324162	179.508792	33000	7788000	48994.709143	9.006943e+06	158.955939
236	2023-12-01	186.927002	164.419532	176.539503	33000	7821000	49171.248645	9.191434e+06	159.056364
237	2024-01-01	179.388000	164.482425	183.958793	33000	7854000	49355.207438	8.853732e+06	159.132144
238	2024-02-01	186.345993	164.573905	177.089936	33000	7887000	49532.297374	9.230145e+06	159.229441
239	2024-03-01	189.483002	164.677692	174.158102	33000	7920000	49706.455477	9.418528e+06	159.335441
240 rows × 9 columns
pd_stock['price'].describe()
count    240.000000
mean     164.677692
std       31.211474
min      119.519997
25%      140.799248
50%      154.909500
75%      186.554245
max      246.610001
Name: price, dtype: float64
pd_stock['heikin_cost'].describe()
count    240.000000
mean     175.874956
std       18.400353
min      158.127092
25%      161.532042
50%      165.438397
75%      197.028935
max      211.888245
Name: heikin_cost, dtype: float64
pd_stock['cost'].describe()
count      240.0
mean     33000.0
std          0.0
min      33000.0
25%      33000.0
50%      33000.0
75%      33000.0
max      33000.0
Name: cost, dtype: float64
グラフ描画
fig, ax = plt.subplots(4,1)
ax[0].plot(pd_stock['price'])
ax[0].set_title('price')
ax[1].plot(pd_stock['kutisu'])
ax[1].set_title('kutisu')
ax[2].plot(pd_stock['price'])
ax[2].plot(pd_stock['mean_price'])
ax[2].set_title('mean_price')
ax[2].plot(pd_stock['heikin_cost'])
ax[3].plot(pd_stock['jika'])
ax[3].plot(pd_stock['cost_sum'])

plt.pause(1)
GBP/JPY
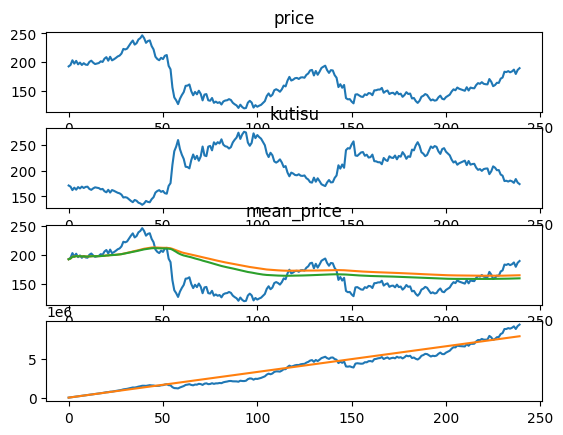
投資総額 口数 総額 利益
7920000 49706 9418528 1498528
ドル/円
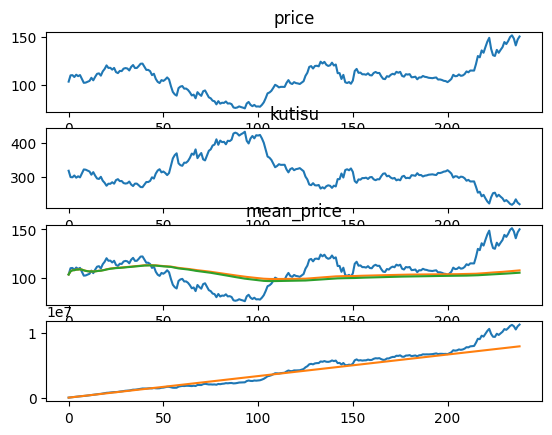
投資総額 口数 総額 利益
7887000 74739 11217935 3330935
ユーロ/円
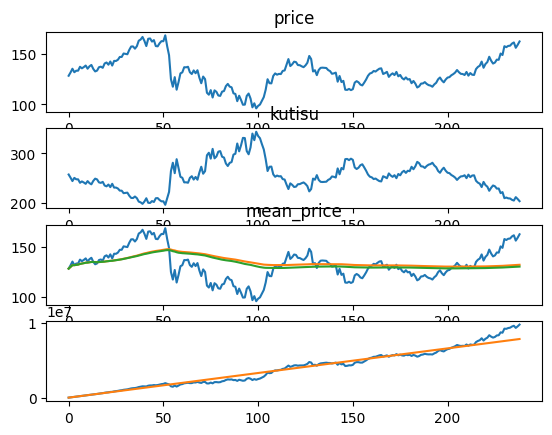
投資総額 口数 総額 利益
7887000 60559 9820745 1933745
ZAR/JPY
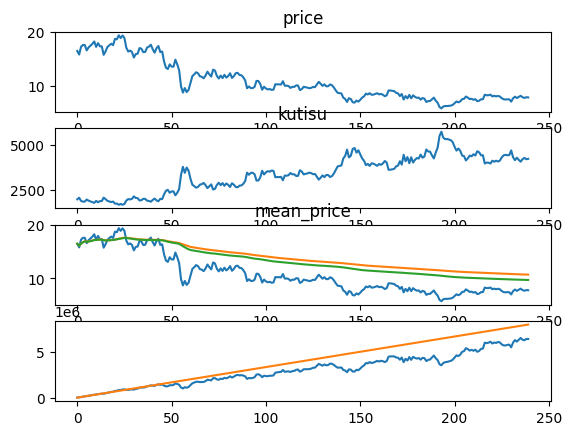
投資総額 口数 総額 利益
7920000 814953 6364214 -1555786
まとめ
・一応、ドルコスト平均法で積立外貨預金を実施した場合のシミュレーションを実施した
・実際には、得られる利益には為替手数料とスワップが大きく、この計算ではおおよその予測しかできていない
・次回は、為替手数料とスワップを適当に入れて計算してみようと思う
・感覚的に価格変動がそこまで大きくないので、株に比べて為替でのドルコスト平均法のメリットは小さいような気がする