先日のFuncAnimationを利用して、FXと株価シミュレータを作ってみた。
前から、シストレやったら儲かるんだろなという期待があるが、これでデモ的だが自前のしかも最新データで遊べるようになった♬
やったこと
・簡単なシミュレータ
・MACDで自動化する
・STSで自動化する
・儲かるのかの考察
・簡単なシミュレータ
以前、こんなグラフを描いてみた。
全体描画のコード
import numpy as np
import pandas as pd
import matplotlib.pyplot as plt

import datetime as dt
import statsmodels.api as sm
from statsmodels.tsa.seasonal import STL
import pandas_datareader.data as DataReader

start = dt.date(2019,1,1)
end = dt.date(2021,3,18)

stock0= 'GBPJPY=X'
df=DataReader.get_data_yahoo("{}".format(stock0),start,end)

print(df)

series=df['Close']
cycle, trend = sm.tsa.filters.hpfilter(series, 144)
df['trend']=  trend

def EMA1(x, n):
    a= 2/(n+1)
    return pd.Series(x).ewm(alpha=a).mean()

series2 = df['trend'].values.tolist()
print(series2[len(series2)-10:len(series2)])

df['Close']=series  #series" #cycle" #trend
df['Close2']=series2
df['y12'] = EMA1(df['Close2'], 12)
df['y26'] =  EMA1(df['Close2'], 26)
df['MACD'] = df['y12'] -df['y26']
df['MACD2'] = df['Close2'] -df['y26']
df['signal2'] = EMA1(df['MACD2'], 9)
df['signal'] = EMA1(df['MACD'], 9)
df['hist_']=df['MACD2']-df['signal2']
date_df=df['Close'].index.tolist()
print(df[len(series)-10:len(series)])

fig, (ax1,ax2) = plt.subplots(2,1,figsize=(1.6180 * 8, 4*2),dpi=200)
ax1.plot(df['Close'],label="series")
ax1.plot(df['Close2'],label="series2")
ax1.plot(df['y12'],label="y12")
ax1.plot(df['y26'],label="y26")
ax2.plot(df['MACD2'],label="MACD2")
# ax2.plot(df['MACD'],label="MACD")
ax2.plot(df['signal2'],label="signal2")
# ax2.plot(df['signal'],label="signal")
ax2.bar(date_df,df['hist_'])
ax1.set_title("{}/{}".format(stock0,"JPY"))
ax1.legend()
ax2.legend()
ax1.grid()
ax2.grid()
plt.savefig("./Fx/fx_{}_ema_df_decompose_%5K%25D_.png".format(stock0))
plt.pause(1)
plt.close()

これの為替変動を生成するようにした。ちょっと、リアル感が得られる。
実際上記のグラフも、以下のデータも日足とは言え、実際のデータである。
Original data生成のコード
import numpy as np
import pandas as pd
import matplotlib.pyplot as plt

import datetime as dt
import statsmodels.api as sm
from statsmodels.tsa.seasonal import STL
import pandas_datareader.data as DataReader

import numpy as np
import matplotlib.pyplot as plt
import matplotlib.animation as animation

start = dt.date(2020,1,1)
end = dt.date(2021,3,23)
stock0='GBPJPY=X'
df=DataReader.get_data_yahoo("{}".format(stock0),start,end)
series=df['Close']
df_date = df['Close'].index.tolist()

fig = plt.figure(figsize=(12, 6))
ax = fig.add_subplot(1, 1, 1)
line,= ax.plot([], [])
print("start")

def gen_function():
    """
    ジェネレーター関数
    """
    x = []
    y = []
    for i in range(len(series)):
        x0 = df_date[i] #np.float(i)
        y0 = series[i] #
        x.append(x0)
        y.append(y0)
    for _x, _y in zip(x, y):
        yield [_x, _y] # 要素要素を戻り値として返す

def init():
    x = df_date
    #x = np.arange(0, len(series), 1)
    y = series
    line, = ax.plot(x, y, 'wo', zorder =0)
    ax.grid(True,zorder=5)
    print("called?")

def plot_func(frame):
    """
    frame[0]: _xの要素
    frame[1]: _yの要素
    """
    ax.plot(frame[0],frame[1], 'b.')
    ax.set_title('{}'.format(stock0))
    plt.pause(0.1) #パラパラ漫画となっている

ani = animation.FuncAnimation( #blit = Falseの場合
    fig=fig,
    func=plot_func,
    frames=gen_function, # ジェネレーター関数を設定
    init_func=init,
    repeat=False, #True,
    save_count = len(series),
)

ani.save("./fig/animated_line_plot_stock_{}_original.gif".format(stock0))
plt.show()

・MACDで自動化する
上では、MACDも動かないけど、これも動かしてみた。
MACDのコード
import numpy as np
import pandas as pd
import matplotlib.pyplot as plt

import datetime as dt
import statsmodels.api as sm
from statsmodels.tsa.seasonal import STL
import pandas_datareader.data as DataReader


import numpy as np
import matplotlib.pyplot as plt
import matplotlib.animation as animation

def EMA1(x, n):
    a= 2/(n+1)
    return pd.Series(x).ewm(alpha=a).mean()

start = dt.date(2020,1,1)
end = dt.date(2021,3,23)
stock0='GBPJPY=X'

df=DataReader.get_data_yahoo("{}".format(stock0),start,end)
series=df['Close']
df_date = df['Close'].index.tolist()
df['y12'] = EMA1(df['Close'], 12)
df['y26'] =  EMA1(df['Close'], 26)
df['MACD'] = df['y12'] -df['y26']
df['signal'] = EMA1(df['MACD'], 9)

fig = plt.figure(figsize=(12, 12))
ax = fig.add_subplot(2, 1, 1)
ax1 = fig.add_subplot(2, 1, 2)
line,= ax.plot([], [])
print("start")
global frame0, gain
frame0 = series
gain = 0

def gen_function():
    """
    ジェネレーター関数
    """
    x = []
    y = []
    z = []
    w = []
    for i in range(len(series)):
        x0 = df_date[i] #np.float(i)
        y0 = series[i] #
        z0 = df['MACD'][i]
        w0 = df['signal'][i]
        x.append(x0)
        y.append(y0)
        z.append(z0)
        w.append(w0)
    for _x, _y,_z, _w in zip(x, y,z,w):
        yield [_x, _y, _z, _w] # 要素要素を戻り値として返す

def init():
    x = df_date
    #x = np.arange(0, len(series), 1)
    y = series
    z = df['MACD']
    w = df['signal']
    line, = ax.plot(x, y, 'wo', zorder =0)
    line1, = ax1.plot(x, z, 'wo', zorder =0)
    line2, = ax1.plot(x, w, 'wo', zorder =1)
    line1, = ax1.plot(x[0], z[0], 'b.',label="MACD")
    line2, = ax1.plot(x[0], w[0], 'r.',label="signal")
    line3, = ax1.bar(x[0], z[0]-w[0], color = 'gray', label="Indicator")
    ax.grid(True,zorder=5)
    ax1.grid(True,zorder=5)
    ax1.legend()
    print("called?")

def calc_gain(hist_, frame,frame0):
    if hist_ >=0:
        gain = frame-frame0
    else:
        gain = frame0-frame
    frame0 = frame
    return gain

def plot_func(frame):
    """
    frame[0]: _xの要素
    frame[1]: _yの要素
    frame[2]: _zの要素
    frame[3]: _wの要素
    """
    ax.plot(frame[0],frame[1], 'b.')
    ax.set_title('{}'.format(stock0))
    ax1.plot(frame[0], frame[2],'b.',label="MACD")
    ax1.plot(frame[0], frame[3],'r.',label="signal")
    hist_ = frame[2]- frame[3]
    g = calc_gain(hist_, frame[1], frame0)
    ax.set_title('{}_gain={}'.format(stock0, g))

    ax1.bar(frame[0],2*hist_, color = 'gray', linewidth=0)
    print(frame[0], frame[1],frame[2])
    print('--------  ', hist_, g, frame0)
    plt.pause(0.1) #パラパラ漫画となっている

ani = animation.FuncAnimation( #blit = Falseの場合
    fig=fig,
    func=plot_func,
    frames=gen_function, # ジェネレーター関数を設定
    init_func=init,
    repeat=False, #True,
    save_count = len(series),
)

ani.save("animated_line_plot_stock_{}_2_gain.gif".format(stock0))
plt.show()
※コード見てくれれば分かるように、毎日データ更新すれば、明日の方向性は見えると思う。
つまり、このindicatorの上げ下げを利用すれば、自動売買も可能だろう。実際には大げさに出たり、上げていても単純には大きくならないので工夫は必要だ。

・STSで自動化する
MACDと同様な手法だが、STSというのがある。
これも同じように描画してみると以下のようになる。ここでは、変動が大きいのでdecomposeしてtrend成分で描画している。
※ここでは、パラメータを26,6を使っている。
STSでは、20%以下の下げは様子見(売らない)、80%以上での上げも様子見(買わない)を推奨している。しかし、これだと最後の上げは買えないということになる。

・儲かるのかの考察
上のシミュレータを見れば明らかにMACDでIndicatorがプラスの瞬間に購入、マイナスになるときに売ればずっと勝ち続けられそうである。
そこで、実際にそれをコードにして、確認しておこう。
因みに、チャートはこの期間における実際の日足を描いており、数値が出るまで計算や予測はしないという約束でやってみる。
なお、コードは下で示しますが、ここでは毎日Indicator通りに売り買いを決め、前日の値からの差分で計算しています。
 したがって、売り駒も買い駒もそれぞれ十分にあるという前提の計算です。
 ある意味一番理想的な場合を示しています。
※一種の信用取引で空売りなどを考えるとこういう条件でもいいと思いますが、
  実際には手数料がかかるので、その分減額されると考えてください
MACDのコード
import numpy as np
import pandas as pd
import matplotlib.pyplot as plt

import datetime as dt
import statsmodels.api as sm
from statsmodels.tsa.seasonal import STL
import pandas_datareader.data as DataReader


import numpy as np
import matplotlib.pyplot as plt
import matplotlib.animation as animation

def EMA1(x, n):
    a= 2/(n+1)
    return pd.Series(x).ewm(alpha=a).mean()

start = dt.date(2020,1,1)
end = dt.date(2021,3,23)
stock0 = 'TSLA'
# stock0= 'USDJPY=X'

df=DataReader.get_data_yahoo("{}".format(stock0),start,end)
series=df['Close']
df_date = df['Close'].index.tolist()
df['y12'] = EMA1(df['Close'], 12)
df['y26'] =  EMA1(df['Close'], 26)
df['MACD'] = df['y12'] -df['y26']
df['signal'] = EMA1(df['MACD'], 9)

fig = plt.figure(figsize=(12, 12))
ax = fig.add_subplot(3, 1, 1)
ax1 = fig.add_subplot(3, 1, 2)
ax2 = fig.add_subplot(3, 1, 3)
line,= ax.plot([], [])
print("start")
global frame0, gain
frame0 = series
gain = 0

def gen_function():
    """
    ジェネレーター関数
    """
    x = []
    y = []
    z = []
    w = []
    for i in range(len(series)):
        x0 = df_date[i] #np.float(i)
        y0 = series[i] #
        z0 = df['MACD'][i]
        w0 = df['signal'][i]
        x.append(x0)
        y.append(y0)
        z.append(z0)
        w.append(w0)
    for _x, _y,_z, _w in zip(x, y,z,w):
        yield [_x, _y, _z, _w] # 要素要素を戻り値として返す

def init():
    x = df_date
    y = series
    z = df['MACD']
    w = df['signal']
    line, = ax.plot(x, y, 'wo', zorder =0, label = "original")
    line1, = ax1.plot(x, z, 'wo', zorder =0)
    line2, = ax1.plot(x, w, 'wo', zorder =1)
    line4, = ax2.plot(x, w, 'wo', zorder =0)
    line1, = ax1.plot(x[0], z[0], 'b.',label="MACD")
    line2, = ax1.plot(x[0], w[0], 'r.',label="signal")
    line3, = ax1.bar(x[0], z[0]-w[0], color = 'gray', label="Indicator")
    line4, = ax2.bar(x[0], z[0]-w[0], color= 'red', label="gain")
    ax.grid(True,zorder=5)
    ax1.grid(True,zorder=5)
    ax2.grid(True,zorder=5)
    ax.legend()
    ax1.legend()
    ax2.legend()
    print("called?")

def calc_gain(hist_, frame,frame0):
    if hist_ >=0:
        gain = frame-frame0
    else:
        gain = frame0-frame
    return gain

def plot_func(frame, frame0, gain_p):
    """
    frame[0]: _xの要素
    frame[1]: _yの要素
    frame[2]: _zの要素
    frame[3]: _wの要素
    """
    ax.plot(frame[0],frame[1], 'b.', label = "original")
    ax1.plot(frame[0], frame[2],'b.',label="MACD")
    ax1.plot(frame[0], frame[3],'r.',label="signal")
    hist_ = frame[2]- frame[3]
    g = calc_gain(hist_, frame[1], frame0)
    gain_p += g
    ax.set_title('{0}_gain={1:3.2f}_{2:3.2f}'.format(stock0, g, frame0))
    ax1.bar(frame[0],2*hist_, color = 'gray', linewidth=0)
    ax2.bar(frame[0],gain_p, color = 'red', linewidth=0)
    print('-------- gain={0:3.2f} {1:3.2f} {2:3.2f} {3:3.2f} {4:3.2f}'. format(gain_p, g, hist_, frame[1], frame0))
    plt.pause(0.1) #パラパラ漫画となっている
    return gain_p

frames = gen_function()
frame = next(frames)
frame0 = frame[1]
gain_p = 0
init()
for i in range(len(series)-1):
    frame = next(frames)
    gain_p = plot_func(frame, frame0, gain_p)
    frame0 = frame[1]

plt.savefig("./fig/line_plot_stock_{}_2_gain_.png".format(stock0))
plt.show()
結果は以下の通りになりました。
株価の例(テスラの場合)

これ見ると、Teslaだからまあ儲かって当たり前なんだけど、よく見ると注意すべきところがある。
上の条件は一旦置いといて気づいたことを記す。
① この株の場合2020-01年初に購入してそのまま保持していて、今売ったとするとかなりな利益が出ている
② 日足だとちょっと無理かなと思ったが、それでもポジティブなgainが得られそうである。
③ 売り買いを毎日すると、必ずしもgainが単調に増加していくわけではない
これは、上げ下げのタイミングと実際の株価の値の日々の値とは必ずしも一致しない(MACDなどは平均化処理が入っている)ので、めぐりあわせ(日々変動)のタイミングによっては、マイナスになるということを示している。
④ 上げ下げが大きい、つまり傾きが大きいところでgainの変化が大きく、希望するプラスのgainが得られている。
⇒すぐに終わってしまうので狙いは難しいが、このことからやはり微分の大きいところを狙って売買するのが効率(手数料等諸経費当たりのgain)という意味でよさそうである
為替の例(ドルの場合)
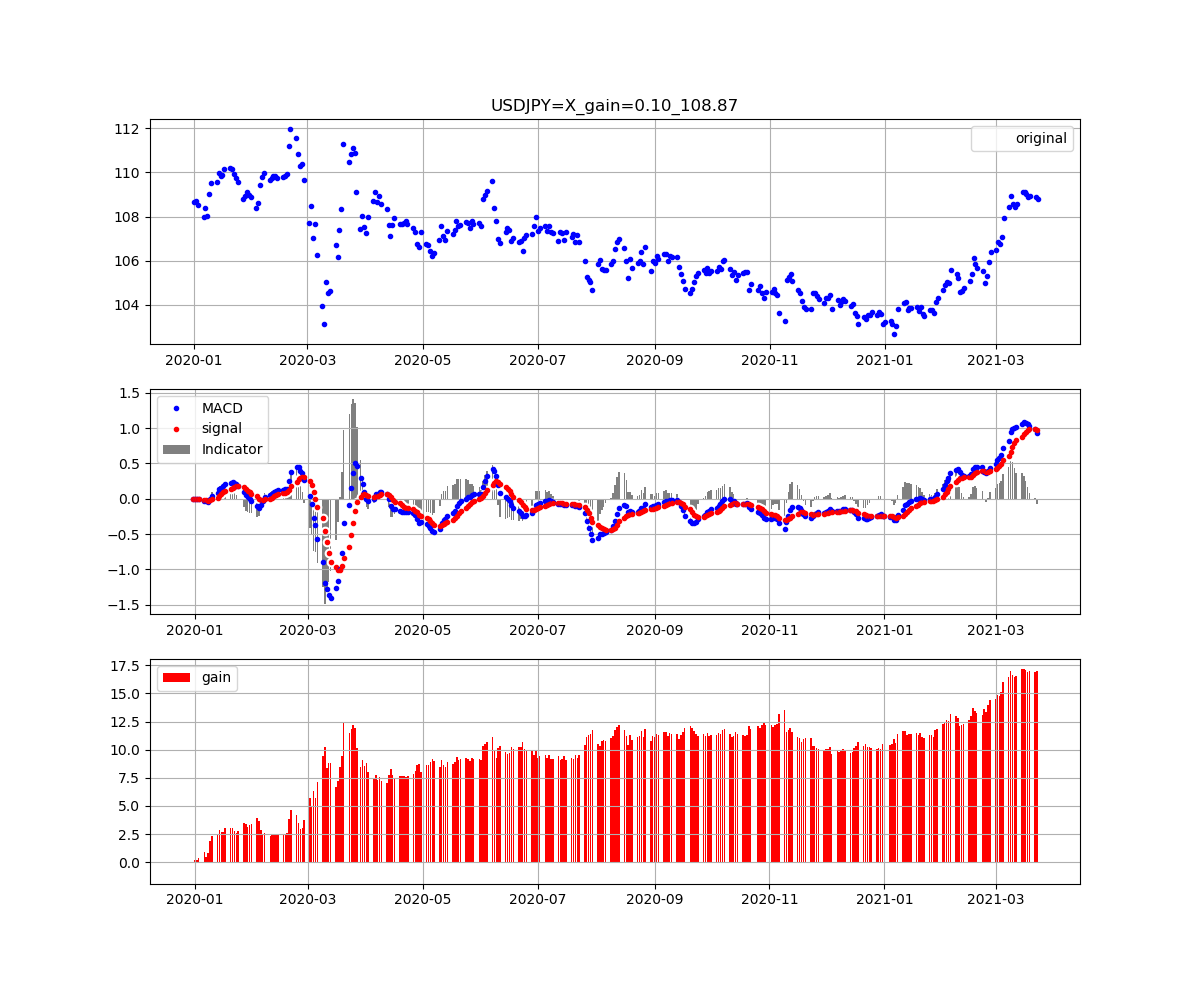
① ドルの場合、一年で上げ下げを経験し、ちょうど戻ってきたところであり、年初に持っていて、今売ったとしても利益は得られない
② 特筆すべきは、2020-08辺りから2021-01までの期間は、ほぼgain=0で儲かっていない。
ここは、全体に下げているところでかつ日々変動が大きくノイズ的なふるまいな結果だろうと推測できる。
③ 大きく変動した2020-3辺りと2021-01から2021-03上旬までの変動期は明確にgainを積み上げている。⇒やはり人間と同じで大きな変動があればgainが大きい
以上のように一応日足ベースでもgainは得られそうであるが、これは実際の売買とはことなり手数料0や売買タイミングも理想的な例なので、実際に適用する場合は、個人の責任で実施してください。
まとめ
・FXと株価生成のシミュレータを作成して遊んでみた
・MACDとSTSの場合の時々刻々のgainを考察し、MACDの場合は実際にgainを計算してみた
・理想的な状況での売買であるが、日足でも一応gainが得られることが判明した
・FXや株価の変動の仕方によっては、マイナスになることもあることが判明した
・ゲーム的なGUIで売買シミュレーションを作成してみる
・実際に適用してみる