本稿は,最適化アルゴリズムとして知られる Nelder–Mead method (ネルダー–ミード法) について,
- Nelder–Mead method を Python で実装する
- アルゴリズムの挙動を matplotlib を用いて GIF 画像として出力する
ことを目的とする.
Nelder–Mead method の概要と実装
アルゴリズムの概要
Nelder–Mead method は 1965 年に John A. Nelder と Roger Mead が発表したアルゴリズム1であり,$n + 1$ 個の頂点からなる $n$ 次元の単体(シンプレックス)をアメーバのように動かしながら関数の最小値を探索する。(Wikipedia より)
例えば,決定変数が $2$ 次元の問題の場合,三角形を動かしながら最適解を探索することとなる.
具体的なアルゴリズムは以下の通り.(文献2を参照した)
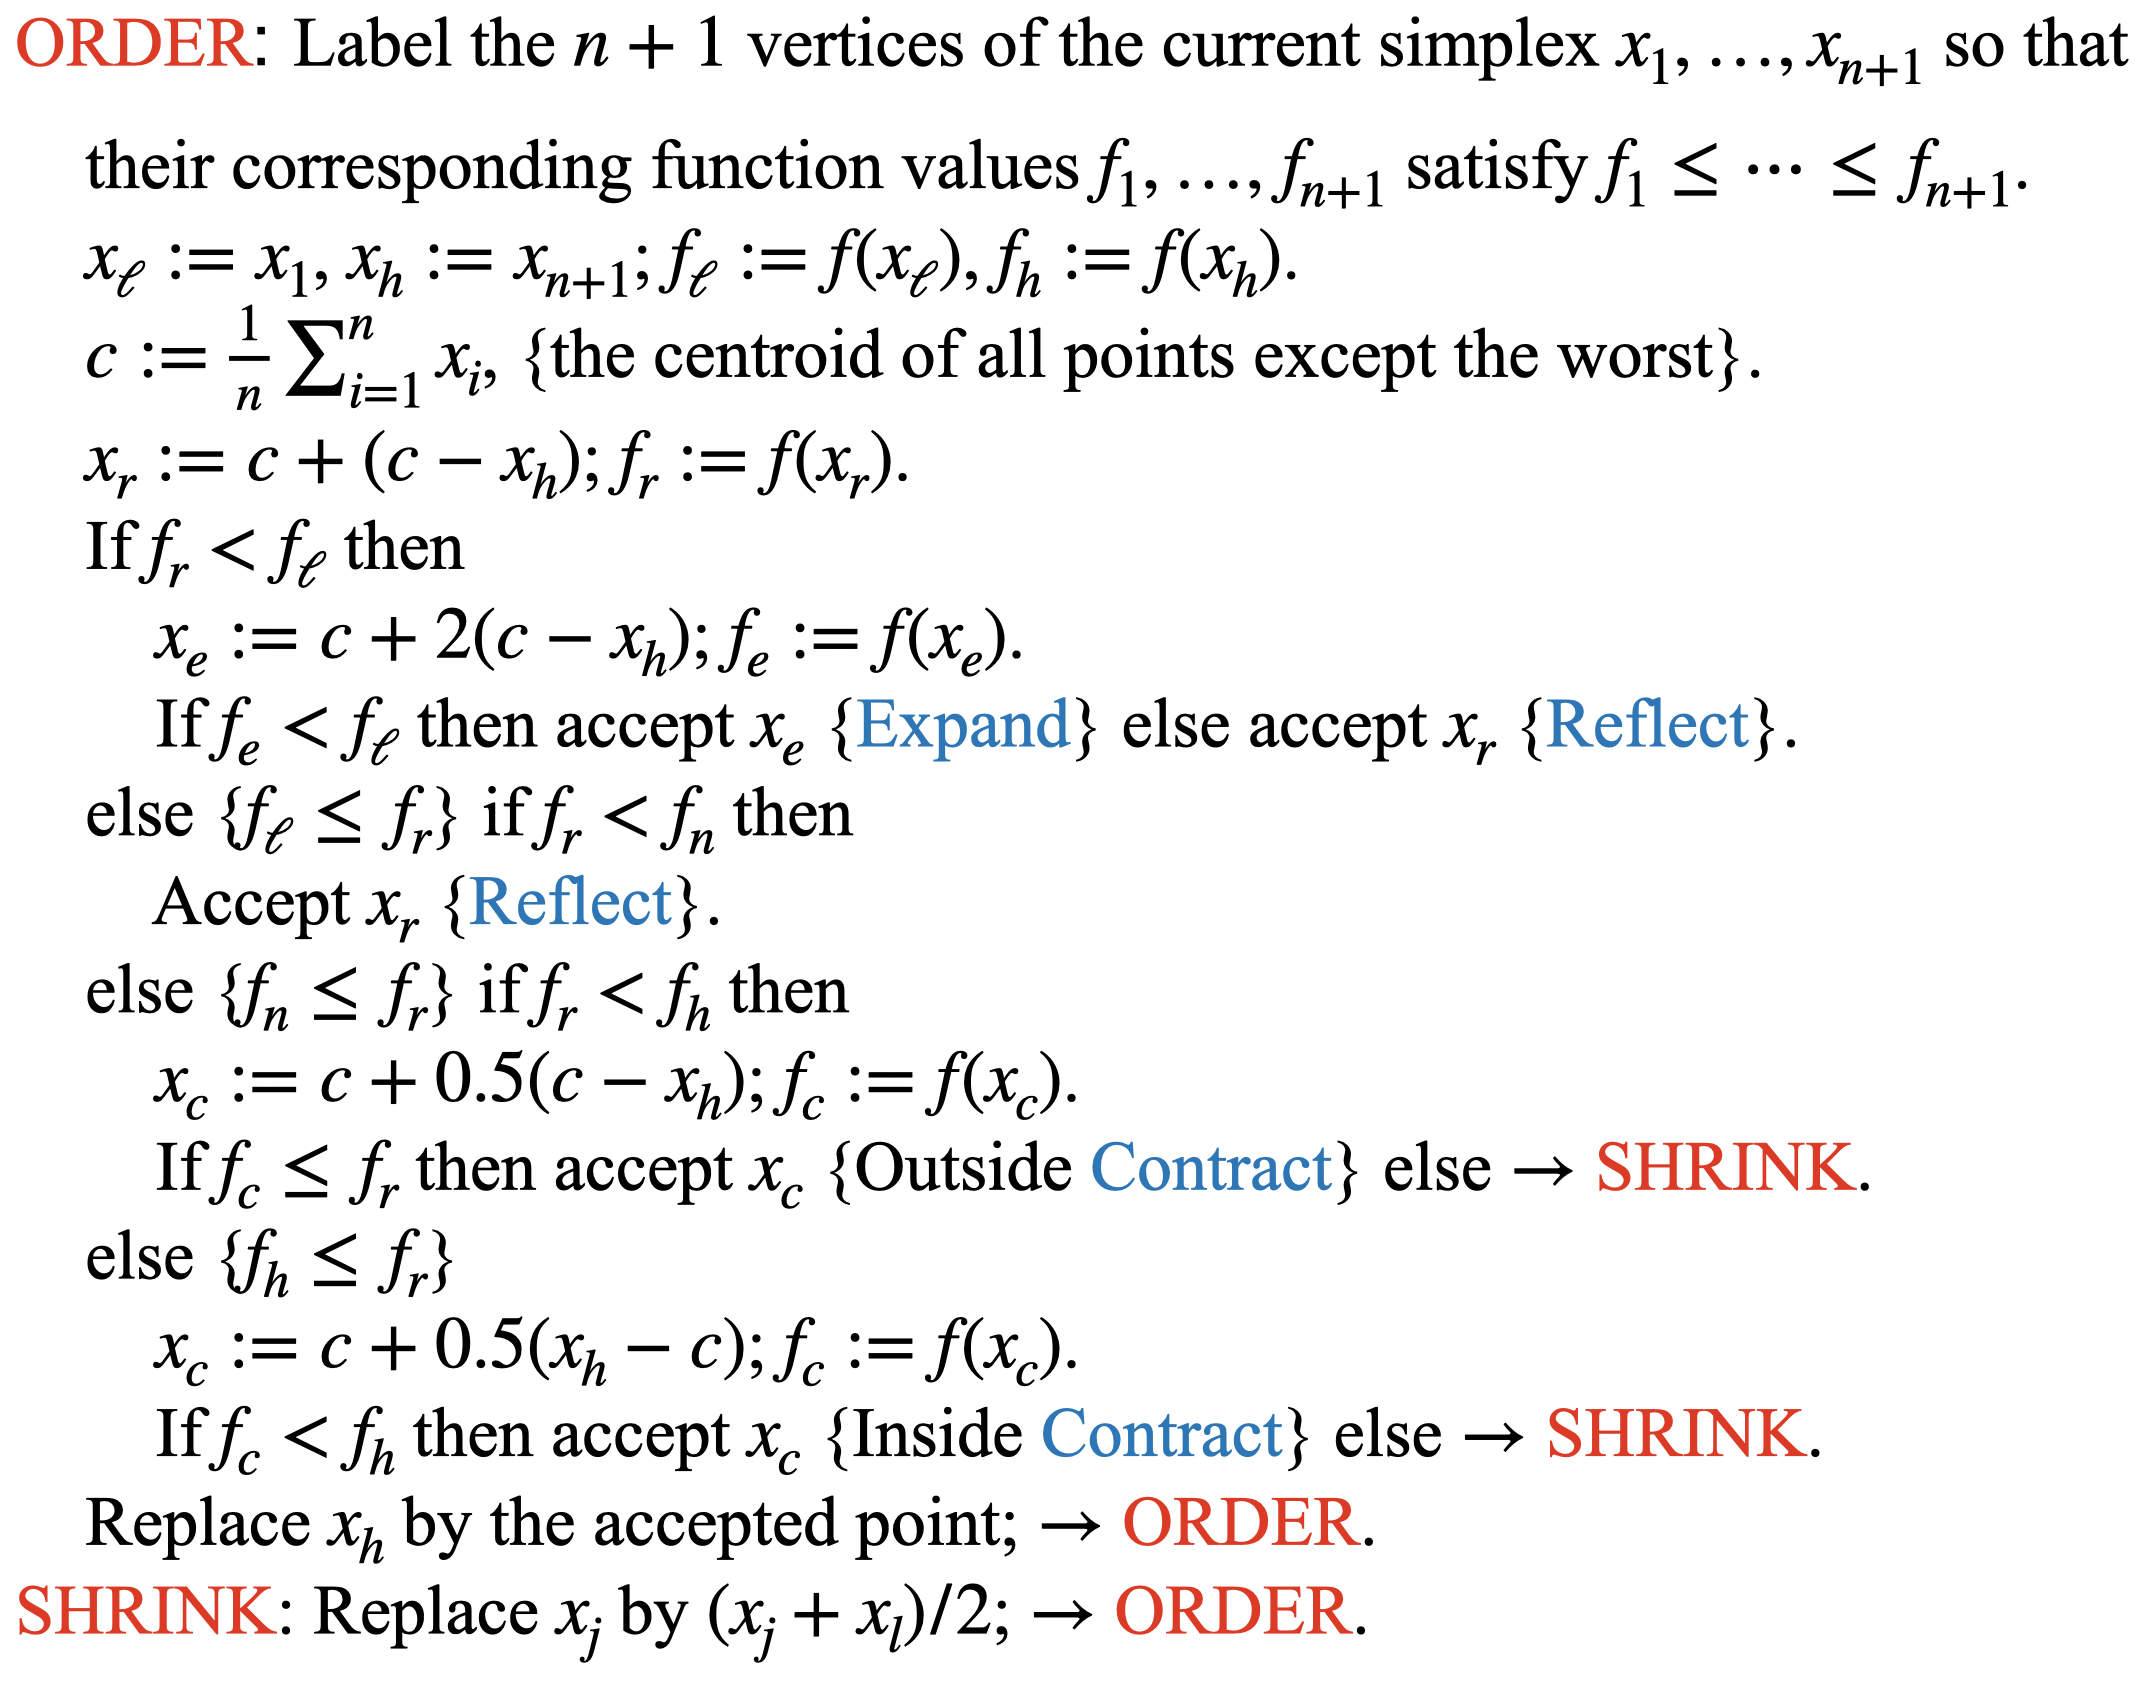
$n+1$ 個の頂点のうち最も大きな関数値を与える点 $x_h$ を更新していく.その際,$x_h$ を除いた $n$ 個の頂点の重心 $c$ を用いて,以下の更新の候補点を計算する,
- 重心 $c$ について対称移動した点 $x_r$ (Reflect: $x_r - c = -(x_h - c)$)
- 重心 $c$ について対称な方向に膨張した点 $x_e$ (Expand: $x_e - c = -2(x_h - c)$)
- 重心 $c$ の近くに収縮した点 $x_c$ (Contract: $x_c - c = \pm 0.5(x_h - c)$)
これらの候補点がいずれも良くないときは,$x_\ell$ を除く全ての点を $x_\ell$ の近くへ収縮する.(SHRINK)
https://codesachin.wordpress.com/2016/01/16/nelder-mead-optimization/
Reflect, Expand, Contract, SHRINK について,このブログの図がわかりやすい.
Python での実装
Python では,scipy.optimize.minimize で method='Nelder-Mead' と指定することで使用することができる.
しかし,本稿では GIF 画像の作成に三角形の全ての頂点を使いたいため,次のように実装した.
from typing import Callable, Tuple, Union

import numpy as np


def _order(x: np.ndarray, ordering: np.ndarray) -> Tuple[np.ndarray, np.ndarray]:
    indices = np.argsort(ordering)
    return x[indices], ordering[indices]

def optimize(
    fun: Callable,
    x0: np.ndarray,
    maxiter: Union[int, None] = None,
    initial_simplex: Union[np.ndarray, None] = None
):
    if x0.ndim != 1:
        raise ValueError(f'Expected 1D array, got {x0.ndim}D array instead')

    # initialize simplex
    if initial_simplex is not None:
        if initial_simplex.ndim != 2:
            raise ValueError(f'Expected 2D array, got {x0.ndim}D array instead')
        x = initial_simplex.copy()
        n = x[0].size
    else:
        h = lambda x: (x[0][x[1]] != 0) * (0.05 - 0.00025) + 0.00025
        n = x0.size
        x = np.array([x0 + h([x0, i]) * e for i, e in enumerate(np.identity(n))] + [x0])

    if maxiter is None:
        maxiter = 200 * n

    # parameters
    alpha = 1.0
    gamma = 2.0
    rho = 0.5
    sigma = 0.5

    # order
    fx = np.array(list(map(fun, x)))
    x, fx = _order(x, fx)

    # centroid
    xo = np.mean(x[:-1], axis=0)
    n_inv = 1 / n

    for _ in range(maxiter):
        fx1 = fx[0]
        fxn = fx[-2]
        fxmax = fx[-1]
        xmax = x[-1]

        xr = xo + alpha * (xo - xmax)
        fxr = fun(xr)

        if fx1 <= fxr and fxr < fxn:
            # reflect
            x[-1] = xr
            fx[-1] = fun(xr)
            x, fx = _order(x, fx)
            xo = xo + n_inv * (xr - x[-1])

        elif fxr < fx1:
            xe = xo + gamma * (xo - xmax)
            fxe = fun(xe)
            if fxe < fxr:
                # expand
                x = np.append(xe.reshape(1, -1), x[:-1], axis=0)
                fx = np.append(fxe, fx[:-1])
                xo = xo + n_inv * (xe - x[-1])
            else:
                # reflect
                x = np.append(xr.reshape(1, -1), x[:-1], axis=0)
                fx = np.append(fxr, fx[:-1])
                xo = xo + n_inv * (xr - x[-1])

        else:
            if fxr > fxmax:
                xc = xo + rho * (xmax - xo)
            else:
                xc = xo + rho * (xr - xo)
                fxmax = fxr
            if fun(xc) < fxmax:
                # contract
                x[-1] = xc
                fx[-1] = fun(xc)
                x, fx = _order(x, fx)
                xo = xo + n_inv * (xc - x[-1])
            else:
                # shrink
                x[1:] = (1 - sigma) * x[0] + sigma * x[1:]
                fx[1:] = np.array(list(map(fun, x[1:])))
                x, fx = _order(x, fx)
                xo = np.mean(x[:-1], axis=0)

    return x, fx
また,Scipy の実装との比較も行なった.($\mathop{\mathrm{minimize}}_{x, y}\quad f(x, y) = x^2 + y^2$)
from scipy.optimize import minimize

maxiter = 25

fun = lambda x: x @ x
x0 = np.array([0.08, 0.08])

# scipy
%time res = minimize(fun=fun, x0=x0, options={'maxiter': maxiter}, method='Nelder-Mead')
xopt_scipy = res.x

# implemented
%time xopt, _ = optimize(fun=fun, x0=x0, maxiter=maxiter)

print('\n')
print(f'Scipy: {xopt_scipy}')
print(f'Implemented: {xopt[0]}')
実行結果
CPU times: user 1.49 ms, sys: 41 µs, total: 1.53 ms
Wall time: 1.54 ms
CPU times: user 1.64 ms, sys: 537 µs, total: 2.18 ms
Wall time: 1.86 ms


Scipy: [-0.00026184 -0.00030341]
Implemented: [ 2.98053651e-05 -1.26493496e-05]
matplotlib による GIF 画像の作成
matplotlib.animation.FuncAnimation を用いて GIF 画像の作成を行なった.
実装の際,次の記事を参考にさせていただいた.
まず,使用する三角形の頂点を計算しておく.
先程の例と同じように,目的関数は $f(x, y) = x^2 + y^2$ とした.
maxiter = 25

fun = lambda x: x @ x
x = np.array([[0.08, 0.08], [0.13, 0.08], [0.08, 0.13]])
X = [x]
for _ in range(maxiter):
    x, fx = optimize(fun, x[0], maxiter=1, initial_simplex=x)
    X.append(x)
これで,X にmaxiter + 1 個の頂点が保存される.
次に,FuncAnimation を用いて GIF 画像を作成する.
FuncAnimation(fig, func, frames, fargs) は func(frames[i], *frags) をひとつのフレームとして GIF 画像を作成する.
import numpy as np
import matplotlib.pyplot as plt
import matplotlib.patches as pat
import matplotlib.animation as animation

def func(x, xmin, xmax, ymin, ymax, xx, yy, vals):
    # clear the current axes
    plt.cla()

    # set x-axis and y-axis
    plt.xlim([xmin, xmax])
    plt.ylim([ymin, ymax])
    plt.hlines(0, xmin=xmin, xmax=xmax, colors='gray')
    plt.vlines(0, ymin=ymin, ymax=ymax, colors='gray')

    # set aspect
    plt.gca().set_aspect('equal', adjustable='box')

    # draw filled contour
    plt.contourf(xx, yy, vals, 50, cmap='Blues')

    # draw triangle
    plt.axes().add_patch(pat.Polygon(x, ec='k', fc='m', alpha=0.2))

    # draw three vertices
    plt.scatter(x[:, 0], x[:, 1], color=['r', 'g', 'b'], s=20)

n_grid=100
delta=0.005
interval=300

xmax, ymax = np.max(X, axis=(0, 1)) + delta
xmin, ymin = np.min(X, axis=(0, 1)) - delta

# function values of lattice points
xx, yy = np.meshgrid(np.linspace(xmin, xmax, n_grid), np.linspace(ymin, ymax, n_grid))
vals = np.array([fun(np.array([x, y])) for x, y in zip(xx.ravel(), yy.ravel())]).reshape(n_grid, n_grid)

fig = plt.figure(figsize=(10, 10))
ani = animation.FuncAnimation(fig=fig, func=func, frames=X, fargs=(xmin, xmax, ymin, ymax, xx, yy, vals), interval=interval)
ani.save("nelder-mead.gif", writer = 'imagemagick')
作成された GIF 画像