matplotlibはデータ解析の可視化ツールとして一般的に用いられています.
今回は,matplotlib.animation機能を使ってgif画像を作ってみたので,そのコードを紹介します.
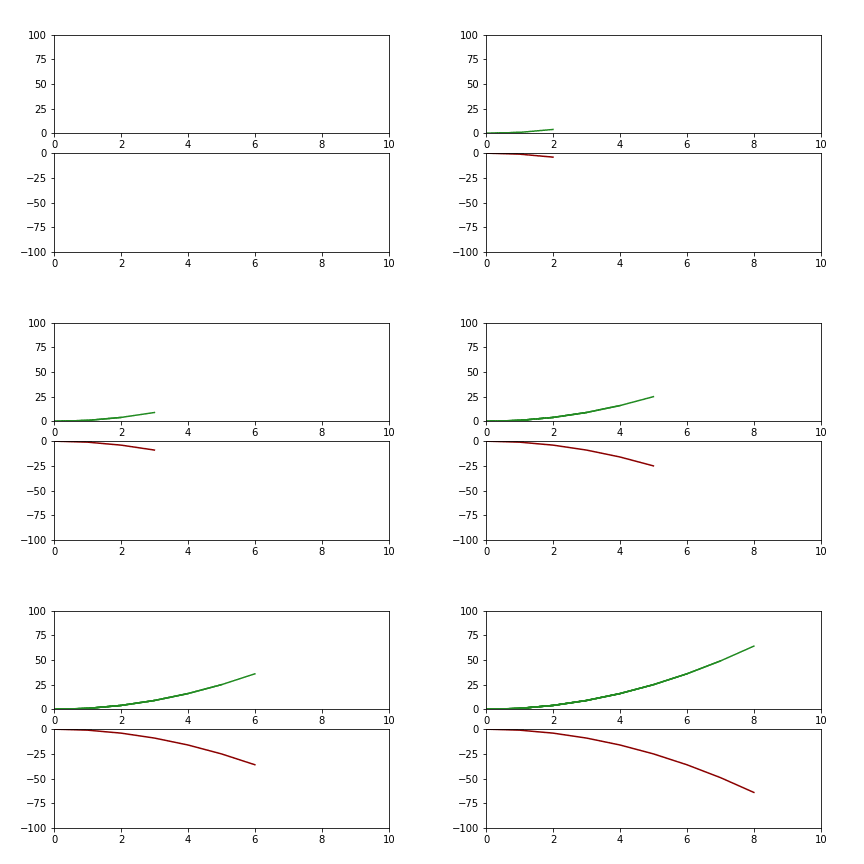
最終的には,以下のgifアニメーションを作りたいとします.
matplotlib.animationには,「ArtistAnimation」機能「FuncAnimation」機能があります.
今回は「FuncAnimation」機能で話を進めます.
「ArtistAnimation」機能については,こちらのページでまとめています.
matplotlib.animationを利用してgif画像を作る (Artist Animation)
こちらのページも参考にさせて頂きました.
動作環境
- Ubuntu
- Anaconda3(Python3.6.6)
- anaconda
Subplot機能を用いずにgif画像を生成
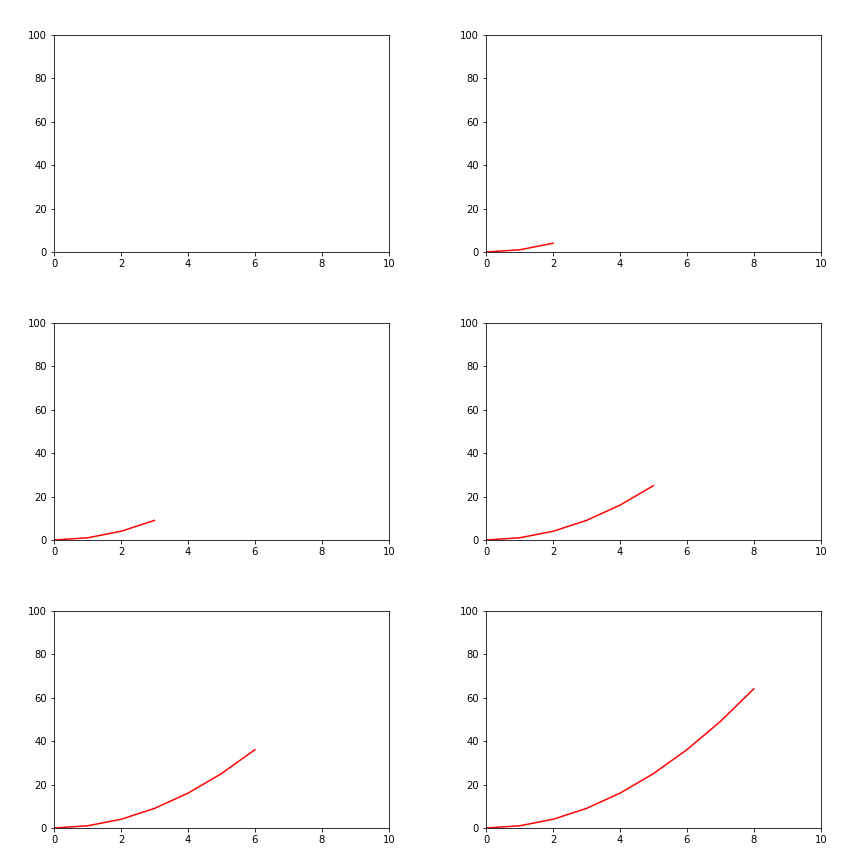
以下のアニメーションを作りたいとします.
コードは以下の通りです.
import numpy as np
import matplotlib.pyplot as plt
import matplotlib.animation as animation

def update(i, x, y):
    if i != 0:
        plt.cla() #現在描写されているグラフを消去
    plt.plot(x[0:i], y[0:i], "r")
    plt.xlim(0,10)
    plt.ylim(0,100)

def draw():
    fig = plt.figure() #figure objectを取得
    x = np.arange(0, 10, 1)
    y = x ** 2
    ani = animation.FuncAnimation(fig, update, fargs = (x, y), interval = 100, frames = 10)
    ani.save("test.gif", writer = 'imagemagick')
draw()関数を実行すると,test.gifが得られます.
以下,FuncAnimationの引数の解説です.
- fig : figure object
- 呼び出す関数(今回はupdate関数)を指定
- fargs = (x,y) : update関数に渡したい引数
- interval : 表示間隔
- frame : update関数を呼び出す回数
subplot機能と組み合わせて使う.
さて,本題です.
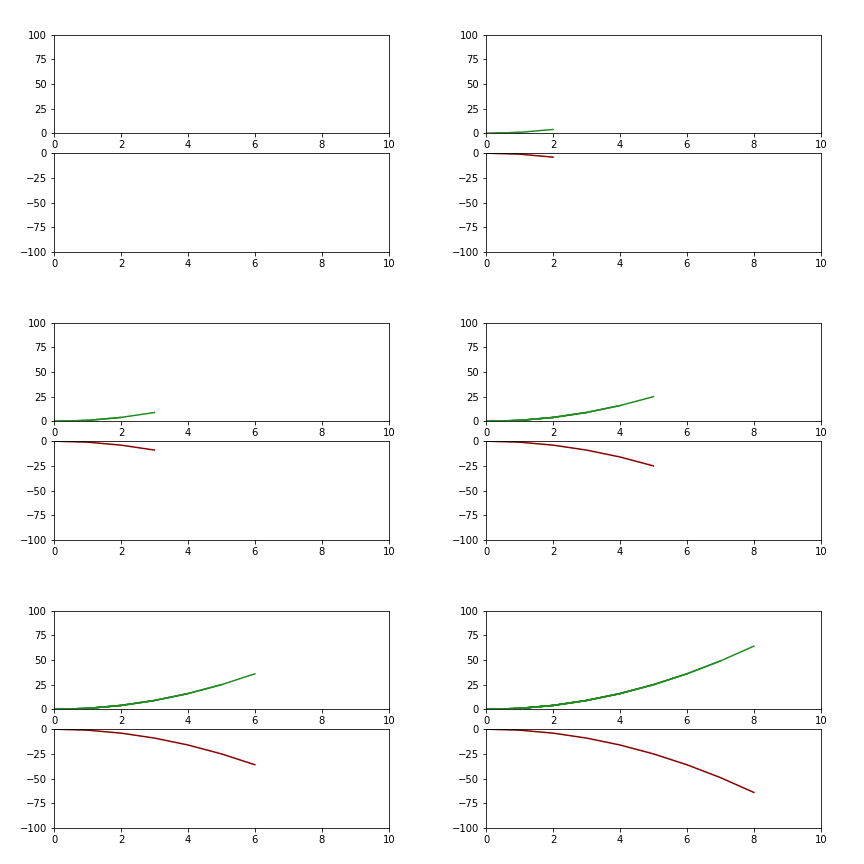
以下のアニメーションを作りたいとします.
コードは以下の通りです.
def update(i, x, y, ax1, ax2):
if i != 0:
plt.cla() #現在描写されているグラフを消去
ax1.plot(x[0:i], y[0:i], "forestgreen")
ax2.plot(x[0:i], -y[0:i], "darkred")
ax1.set_xlim(0,10)
ax1.set_ylim(0,100)
ax2.set_xlim(0,10)
ax2.set_ylim(-100,0)
def draw():
fig = plt.figure() #figure objectを取得
fig, (ax1, ax2) = plt.subplots(2,1)
x = np.arange(0, 10, 1)
y = x ** 2
ani = animation.FuncAnimation(fig, update, fargs = (x, y, ax1, ax2), interval = 100, frames = 10)
ani.save("test.gif", writer = 'imagemagick')
draw()関数を実行することでtest.gifが得られます.
まとめ
animation機能を使えば,計算過程を可視化出来たるすると思います.
相手にも伝わりやすくなるかもしれません.


