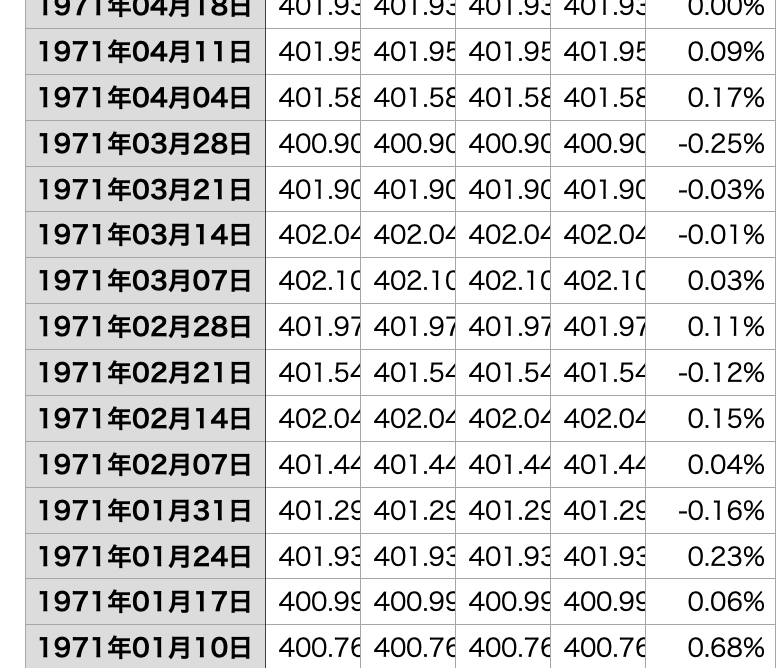
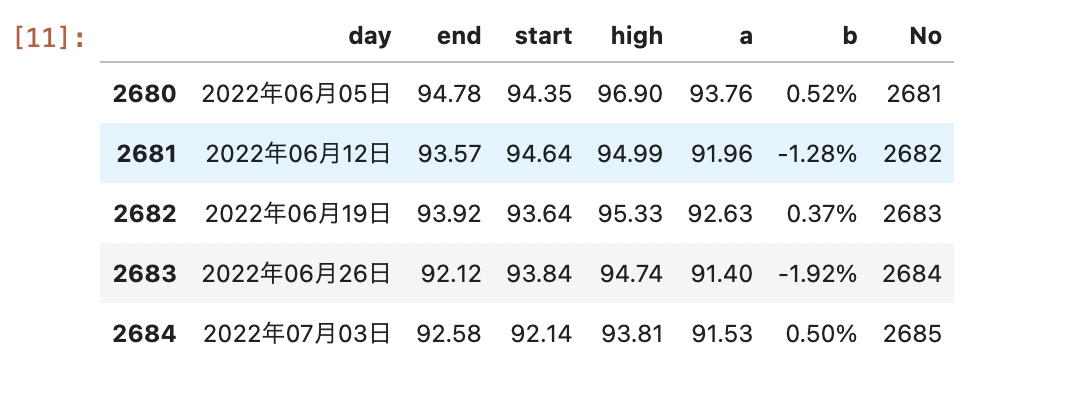
https://jp.investing.com/currencies/aud-jpy-historical-data
ここで20年分のデータを取得
日付を指定して、1971〜2022年の週ごとのデータ
を取得した!!
あ 次は jupyter labの操作~?
from sklearn import linear_model #AI線形モデル
from sklearn.linear_model import LinearRegression #上のやつとどう違うのかわからんなんかエラーが出たので読み込みました
import numpy as np #なんだっけこれ
import pandas as pd #笹

from sklearn.model_selection import train_test_split #分けるやつ
from sklearn.metrics import mean_squared_error #性能評価の

import matplotlib.pyplot as plt #グラフのやつ
#csvの読み込み!
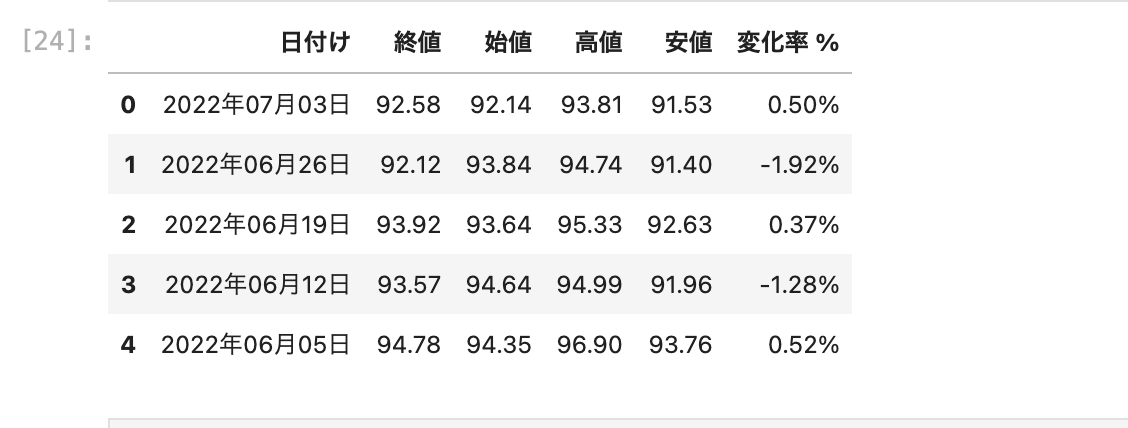
go_data = pd.read_csv("AUD_JPY 過去データ.csv")
go_data.head()
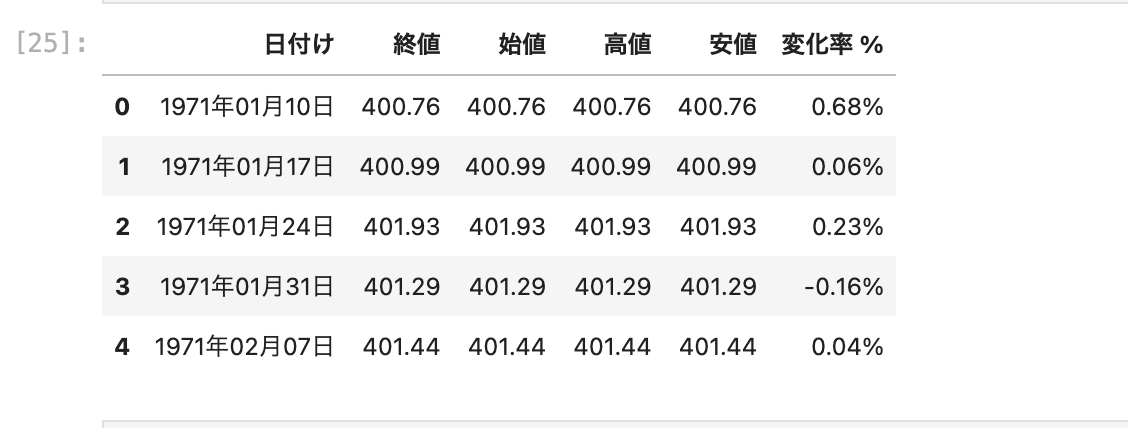
#行を逆に 古いものを上に
go_data = go_data.iloc[::-1]
go_data.index = range(len(go_data))
go_data.head()
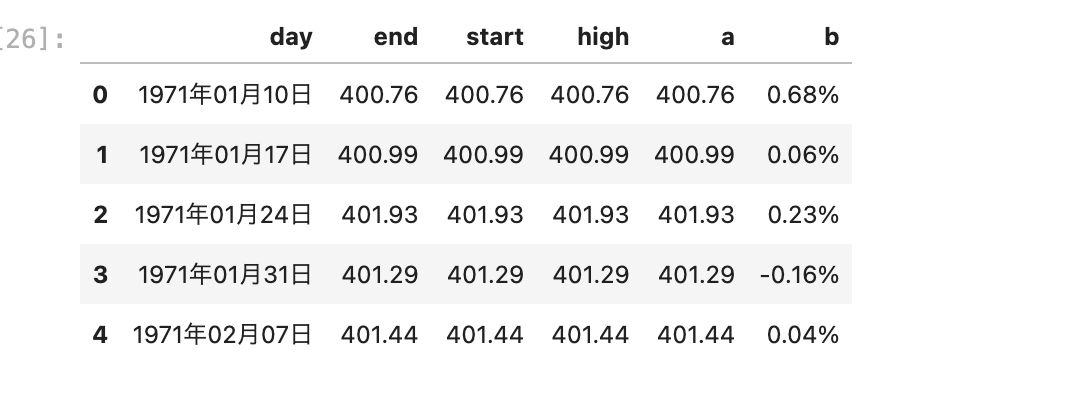
#columnがjapaneseなのでとりあえず適当に
go_data = go_data.rename(columns={'日付け': 'day','終値': 'end','始値':'start','高値':'high','安値':'a','変化率 %':'b'})
go_data.head()
本当は日付を使いたかったけど年月日表記だったので、、
# Noというcolumnを作成
serial_num = pd.RangeIndex(start=1, stop=len(go_data.index) + 1, step=1)
go_data['No'] = serial_num
go_data.tail() #末尾から確認
#終値をX NoをY
X = go_data.loc[:, ['end']]
Y = go_data.loc[:, ['No']]
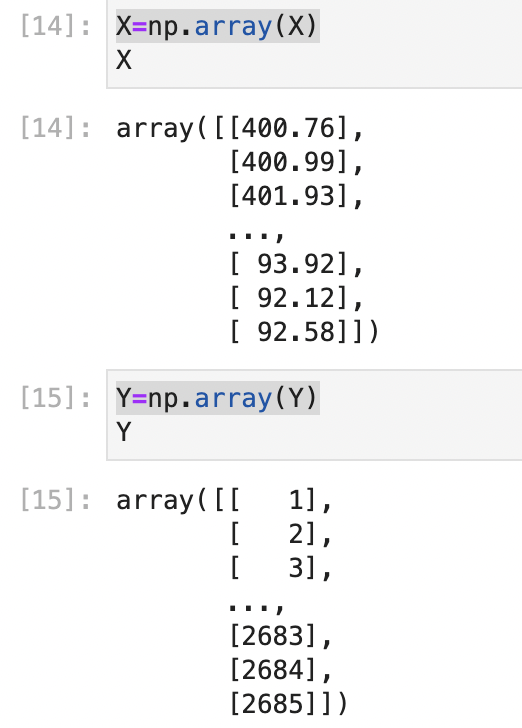
2次元?変換しました
X=np.array(X)
Y=np.array(Y)
#train,test,validに分ける~
X_train, X_test, Y_train, Y_test = train_test_split(X, Y,train_size=0.8)
X_train, X_valid, Y_train, Y_valid = train_test_split(X_train, Y_train, train_size=0.8)
# 線形回帰モデル
linear_model = LinearRegression()
# 学習はfit
linear_model.fit(X_train, Y_train)
予測
Y_pred = linear_model.predict(X_valid)
print('正解')
print(Y_valid[:5]) #正解
print()
print('予測')
print(Y_pred[:5]) #予測

#正解
#[[1959]
# [ 603]
# [1576]
# [ 215]
# [1430]]
#
#予測
#[[1629.88111471]
# [ 704.46442219]
# [1842.63881907]
# [ -89.27869522]
# [1710.26016458]]
うーん、うーん うーん???うーん??????
ん -89....? 貴様は一体何を予測したのか?
初めて自分でやってみたけどあわよくばこれでFXで大儲けしてやろうと思った!が!
ここまでやるので疲れた、
わからないことをたくさん調べて2日間かかったがなかなか楽しかったですね!!本当にほとんどがDataFrameの加工でした
誰かこの記事を見かけた方、データの加工方法、記事の書き方なんでも良いです、アドバイスください。希望
間違ったりしているところは指摘が欲しいです。
これを後 もっと未来のやつ予測して、日本のやつも予測して
グラフ化して FXで大儲けする予定です、あ,もう大富豪になる事は
すぐそこですね!!実行
linear_model_mse = mean_squared_error(Y_valid, Y_pred)
print('MSE(1変数の線形回帰モデル):', linear_model_mse)
#MSE(1変数の線形回帰モデル): 213280.85603394746
誤差213280だってよ。
ははあ なるほどお、 わからんわ謎
読んでくれてありがとうさぎ
お尻
