In this article, I would like to introduce how to use Chart.js by supplying data from Sharperlight.

When Sharperlight is installed, Chart.js is also included and ready to use.
Create an HTML file (including Scripts) that displays a Chart.js bar chart and embed it as a custom in a web report created with Publisher.
Requires two published reports. One is the custom report and the other is used to provide the dataset for the custom report.
The HTML with Script is embedded to Custom HTML option on Options tab of the custom report.

The full code is attached at the end of this article. Let's take a look at the key parts one by one.
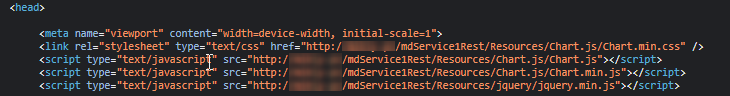
< head > part
Here we will refer to the Chart.js code files and class files that are installed with Sharperlight. Reference them using the Sharperlight service.
{*Url.Root} is a Sharperlight built-in control tag that will be replaced at runtime with the actual Sharperlight service URL.
<link rel="stylesheet" type="text/css" href="{*Url.Root}Resources/Chart.js/Chart.min.css" />
<script type="text/javascript" src="{*Url.Root}Resources/Chart.js/Chart.js"></script>
<script type="text/javascript" src="{*Url.Root}Resources/Chart.js/Chart.min.js"></script>
<script type="text/javascript" src="{*Url.Root}Resources/jquery/jquery.min.js"></script>
At runtime、
< body > part
Here we have the definition of the actual HTML object, the canvas to draw the bar chart.
<div class="slpt-row">
   <div class="slpt-title"></div>
   <div class="slpt-leftCell">
       <canvas id="chart-area1" class="slpt-ca-1"></canvas>
   </div>
</div>
< Script >
Write the script in the body section.
We call the _Start() function from the $(document).ready event, and then call populateContents().
Inside the populateContents() function, we draw a Chart.js bar chart.
First, prepare the data to be displayed in the bar chart. Create a query as another Published Report and use it as the data source here.

The URL will be like this because it will be called using the Sharperlight service.
http://{your server name}/mdService1Rest/DataSource/?query=PresentationDS.VBarChart12MthEn&dfmt=jsonarray&dcat=UseNames
The place to specify this URL in the code is URL: gURL_DS001.
try{
   var jsonData = $.ajax({
       url: gURL_DS001,
       dataType: 'json',
       }).done(
           function (results) {
Here, the gURL_DS001 variable holds that URL.
You can write the URL directly here, but the URL, that is, the dataset, will be fixed, so we will use the parameters of this custom report to generate the full URL of the dataset at runtime. .
As a parameter, pass only the name of the Sharperlight query that supplies the dataset, and use the name to construct the URL with an expression as an output item of the query.

The constructed URL can be fetched with this tag "{*Row.dsURLChart.text}" from the script.
This is the part.
var gURL_DS001 = "{*Row.dsURLChart.text}";
At runtime it will look like this.

Each column value of the dataset retrieved by the ajax call can be referenced by the output name of the data-supplying query.
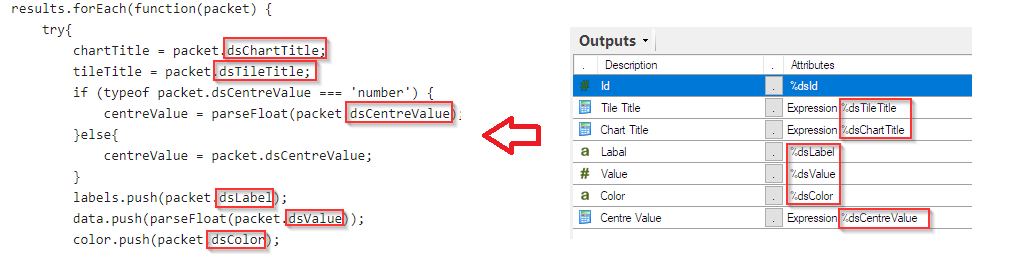
This way, you can design datasets with Sharperlight queries, feed data into reports you create as custom reports, use charts and more in your favorite JavaScript framework.
I wrote this artcle to show the avility of custamisation.
However, Sharperlight has its own charts options as well so basicall you don't need to write such scripts etc.

I'll paste the whole code below.
<html>
   <head>
        <meta charset="utf-8"/>
        <base href="{*Url.Root}"/>
        <link rel="shortcut icon" type="image/x-ico" href="favicon.ico"/>
        <link rel="icon" type="image/x-ico" href="favicon.ico"/>
        <title>Qiita Sample</title>
        <meta name="viewport" content="width=device-width, initial-scale=1">
        <link rel="stylesheet" type="text/css" href="{*Url.Root}Resources/Chart.js/Chart.min.css" />
        <script type="text/javascript" src="{*Url.Root}Resources/Chart.js/Chart.js"></script>
    	<script type="text/javascript" src="{*Url.Root}Resources/Chart.js/Chart.min.js"></script>
    	<script type="text/javascript" src="{*Url.Root}Resources/jquery/jquery.min.js"></script>

        <style>
            body{
                overflow: hidden;
                width: 450px;
                height: 200px;
            }
            canvas {
                -moz-user-select: none;
                -webkit-user-select: none;
                -ms-user-select: none;
            }
            .slpt-title{
                position: absolute;
                top: 10px;
                left: 15px;
                font-size: 20px;
                font-family: Arial;
            }
            .slpt-ca-1 {
                display: block;
                /* width: 100%;
                height: 100%; */
                margin-top: 12px;
            }
            .slpt-ca-2 {
                display: block;
                width: 100%;
                height: 100%;
            }
            .slpt-row {
                clear: both;
                width: 100%;
                height: 100%;
                margin: 0px;
                padding: 0px;
            }
            .slpt-leftCell {
                float: left;
                margin-top: 20px;
                border: 0px;
                height: 210px;
                width: 250px;
            }
            .slpt-rightCell {
                float: left;
                margin-left: -130px;
                margin-top: 12px;
                border: 0px;
                height: 150px;
                width: 250px;
            }

        </style>
   </head>
   <body>
        <div class="slpt-row">
            <div class="slpt-title"></div>
            <div class="slpt-leftCell">
                <canvas id="chart-area1" class="slpt-ca-1"></canvas>
            </div>
        </div>

        <script>
            var gDsSomething;       //Data Source
            var gURL_DS001 = "{*Row.dsURLChart.text}";
            var gConfig;

            $(document).ready(function(e) { _Start(e) });


            function _Start(e){
                try {
                    populateContents();
                }catch(err){
                    console.log(err.name, 'Error in _Start(): ' + err.message);
                }
            }

            function populateContents(){
                try{
                    var jsonData = $.ajax({
                        url: gURL_DS001,
                        dataType: 'json',
                        }).done(
                            function (results) {
                                try{
                                    // Split timestamp and data into separate arrays
                                    var labels = [], data=[]; color=[];
                                    var chartTitle = '';
                                    var tileTitle = '';
                                    var centreValue = '0';
                                    results.forEach(function(packet) {
                                        try{
                                            chartTitle = packet.dsChartTitle;
                                            tileTitle = packet.dsTileTitle;
                                            if (typeof packet.dsCentreValue === 'number') {
                                                centreValue = parseFloat(packet.dsCentreValue);
                                            }else{
                                                centreValue = packet.dsCentreValue;
                                            }
                                            labels.push(packet.dsLabel);
                                            data.push(parseFloat(packet.dsValue));
                                            color.push(packet.dsColor);
                                        }catch (err){
                                            console.log(err.name, 'populateContents_Core() Chart-> ajax:forEach: ' + err.message);
                                        }
                                    });

                                    $(".slpt-title").text(tileTitle);

                                    //Populate Config
                                    gConfig = {
                                        type: 'horizontalBar',
                                        data: {
                                            datasets: [{
                                                axis: 'y',
                                                data: data,
                                                backgroundColor: color,
                                                borderWidth: 1,
                                                barThickness: 6
                                            }],
                                            labels: labels
                                        },
                                        options: {
                                            //indexAxis: 'y',
                                            maintainAspectRatio: false,
                                            responsive: true,
                                            scales: {   // For Chart.js version 3.x
                                                x: {
                                                    beginAtZero: true
                                                }
                                            },
                                            scales: {   // For Chart.js version 2.x
                                                xAxes: [{
                                                    ticks: {
                                                        beginAtZero: true
                                                    }
                                                }]
                                            },
                                            title: {
                                                display: true,
                                                position: 'bottom',
                                                text: chartTitle
                                            },
                                            legend: {
                                                display: false
                                            }
                                        }
                                    };

                                    var ctx = document.getElementById("chart-area1").getContext("2d");
                                    window.myDoughnut = new Chart(ctx, gConfig);

                                }catch (err){
                                    console.log(err.name, 'populateContents_Core() Chart-> ajax: ' + err.message);
                                }
                            }
                        );

                    }catch (err){
                        console.log(err.name, 'populateContents_Core(): ' + err.message);
                    }
            };
        </script>
    </body>
</html>