Web report created with Sharperlight Publisher can also be used as containers for web interfaces created using HTML and JavaScript. Let's look at a simple example here.
Sharperlight has JavaScript libraries such as jquery, KendoUI, yui, D3, Chart.Js is enclosed. You can use them to create web interfaces.
This time, I will use Chart.Js to display a line graph. The underlying data is also defined as a published query in the publisher.
Preparing the datasource
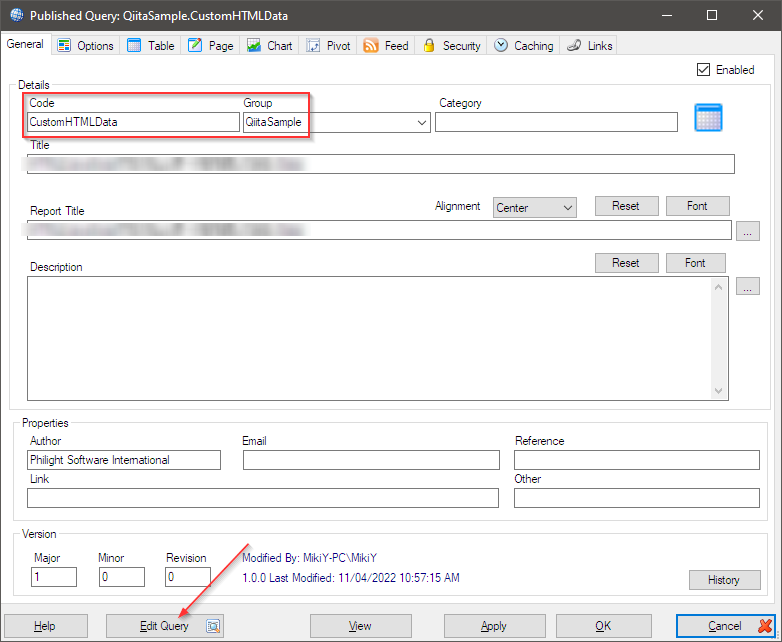
Launch the publisher to create a published query.
After entering the group name and code, start editing the query.
Use a Custom Defined Dataset. Let's prepare a dataset like this.
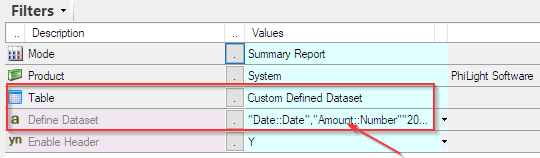
"Date::Date","Amount::Number"
"2022-03-01",1000.00
"2022-03-02",1150.00
"2022-03-03",1050.00
"2022-03-04",1200.00
"2022-03-05",1259.00
"2022-03-06",1268.00
"2022-03-07",1300.00
"2022-03-08",1320.00
"2022-03-09",1340.00
"2022-03-10",1358.00
"2022-03-11",1390.00
"2022-03-12",1400.00
"2022-03-13",800.00
"2022-03-14",1410.00
"2022-03-15",1430.00
"2022-03-16",1459.00
"2022-03-17",1500.00
"2022-03-18",1523.00
"2022-03-19",1523.00
"2022-03-20",1558.00
"2022-03-21",1590.00
"2022-03-22",1600.00
"2022-03-23",1696.00
"2022-03-24",1750.00
"2022-03-25",1754.00
"2022-03-26",1759.00
"2022-03-27",1770.00
"2022-03-28",1800.00
"2022-03-29",1850.00
"2022-03-30",1900.00
"2022-03-31",2000.00
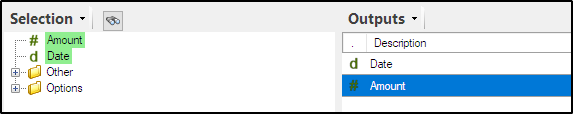
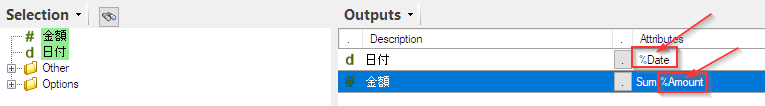
Set the Date and Amount fields to Output and press OK to confirm. Dataset ready.
Preparing HTML and JavaScript code
Prepare code like this.
<!DOCTYPE html>
<!-- Ver 01 00 00 -->
<html>
<head>
	<meta charset="utf-8"/>
	<base href="{*Url.Root}">
	<link rel="shortcut icon" type="image/x-ico" href="favicon.ico" />
    <link rel="icon" type="image/x-ico" href="favicon.ico" />
	<title>ChartJS Sample</title>

	<link rel="stylesheet" type="text/css" href="{*Url.Root}Resources/Chart.js/Chart.min.css" />

	<script type="text/javascript" src="{*Url.Root}Resources/Chart.js/Chart.js"></script>
    <script type="text/javascript" src="{*Url.Root}Resources/Chart.js/Chart.min.js"></script>
    <script type="text/javascript" src="{*Url.Root}Resources/jquery/jquery.min.js"></script>
</head>
<body style="font-family: arial; font-size:13px">
    <div class="chart-container" style="position: relative; height:400px; width:750px">
        <canvas id="myLineChart"></canvas>
    </div>

    <script>
        var gDsSomething;       //Data Source
        var gURL_ReadSomething = "{*Row.URLCustomHTMLData.text}";

		$(document).ready(function(e) { ChartJS_Sample_Start(e) });

        function drawLineChart() {
            // Add a helper to format timestamp data
            Date.prototype.formatMMDDYYYY = function() {
                return (this.getMonth() + 1) +
                "/" +  this.getDate() +
                "/" +  this.getFullYear();
            }

            var jsonData = $.ajax({
                url: gURL_ReadSomething,
                dataType: 'json',
                }).done(
                    function (results) {
                        // Split timestamp and data into separate arrays
                        var labels = [], data=[];
                        results.forEach(function(packet) {
                            labels.push(new Date(packet.Date).toLocaleDateString());
                            data.push(parseFloat(packet.Amount));
                        });

                        // Create the chart.js data structure using 'labels' and 'data'
                        var tempData = {
                            labels : labels,
                            datasets : [
                                {
                                label                 : 'Dataset Sample',
                                fillColor             : "rgba(151,187,205,0.2)",
                                strokeColor           : "rgba(151,187,205,1)",
                                pointColor            : "rgba(151,187,205,1)",
                                pointStrokeColor      : "#fff",
                                pointHighlightFill    : "#fff",
                                pointHighlightStroke  : "rgba(151,187,205,1)",
                                data                  : data
                                }
                            ]
                        };

                        // Get the context of the canvas element we want to select
                        var ctx = document.getElementById("myLineChart").getContext("2d");

                        // Instantiate a new chart
                        var myLineChart = new Chart(ctx, {
                                                        type: 'line',
                                                        data: tempData,
                                                        options: {
                                                            responsive: true,
                                                            maintainAspectRatio: false,
                                                            scales: {
                                                                xAxes: [{
                                                                    ticks: {
                                                                        autoSkip: false,
                                                                        maxRotation: 45,
                                                                        minRotation: 45
                                                                    }
                                                                }]
                                                            }
                                                        }
                                                    });
                    }
                );
        };

        function ChartJS_Sample_Start(e){
        try {
            drawLineChart();
        }catch(err){
            alert("Error in ChartJS_Sample_Start(): " + err.message);
        }
        };
	</script>
</body>
</html>
I'll look at them one by one.
This is the head part.
It has reference syntax for stylesheets and JavaScript frameworks.
The {*Url.Root} part in it will be replaced with the URL of the REST service of Sharperlight at runtime.
<head>
	<meta charset="utf-8"/>
	<base href="{*Url.Root}">
	<link rel="shortcut icon" type="image/x-ico" href="favicon.ico" />
    <link rel="icon" type="image/x-ico" href="favicon.ico" />
	<title>ChartJS Sample</title>

	<link rel="stylesheet" type="text/css" href="{*Url.Root}Resources/Chart.js/Chart.min.css" />

	<script type="text/javascript" src="{*Url.Root}Resources/Chart.js/Chart.js"></script>
    <script type="text/javascript" src="{*Url.Root}Resources/Chart.js/Chart.min.js"></script>
    <script type="text/javascript" src="{*Url.Root}Resources/jquery/jquery.min.js"></script>
</head>
At runtime it looks like this:

The next thing to pay attention to is this part.
    <script>
        var gDsSomething;       //Data Source
        var gURL_ReadSomething = "{*Row.URLCustomHTMLData.text}";

		$(document).ready(function(e) { ChartJS_Sample_Start(e) });

        function drawLineChart() {
            // Add a helper to format timestamp data
            Date.prototype.formatMMDDYYYY = function() {
                return (this.getMonth() + 1) +
                "/" +  this.getDate() +
                "/" +  this.getFullYear();
            }

            var jsonData = $.ajax({
                url: gURL_ReadSomething,
                dataType: 'json',
                }).done(
                    function (results) {
                        // Split timestamp and data into separate arrays
                        var labels = [], data=[];
                        results.forEach(function(packet) {
                            labels.push(new Date(packet.Date).toLocaleDateString());
                            data.push(parseFloat(packet.Amount));
                        });
First, this partvar gURL_ReadSomething = "{*Row.URLCustomHTMLData.text}";
It prepares a URL for retrieving the data used in this HTML page. Where it comes from is the published query for the datasource defined earlier in this article.
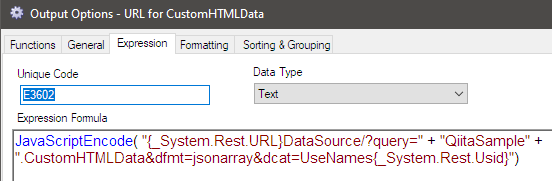
And the URL to call this published query as a data source (which returns JSON) is;
http://{YourSeverName}/mdService1Rest/DataSource/?query=QiitaSample.CustomHTMLData&dfmt=jsonarray&dcat=UseNames
Normally this URL can be written directly in the JavaScript code, but the URL is defined using an expression in the published query that is the container for this JavaScript code. Here we use a control tag {*Row.URLCustomHTMLData.text} to get that URL. This is because if the URL changes later, you can simply change the expression defined in the published query instead of changing the JavaScript code.
That url is used in this ajax call part.
var jsonData = $.ajax({
                url: gURL_ReadSomething,
                dataType: 'json',
The next thing to pay attention to is how the retrieved data is converted into a format that can be used by Chart.JS. Here is the point.
// Split timestamp and data into separate arrays
       var labels = [], data=[];
       results.forEach(function(packet) {
           labels.push(new Date(packet.Date).toLocaleDateString());
           data.push(parseFloat(packet.Amount));
       });
Here I am creating the labels and data arrays respectively from the retrieved datasets. See the Chart.JS spec for why I do that.
Remember the dataset above. Here the label is Date and the data is Amount.
At labels.push I am passing packet.Date. The packet.Date part, which points to the name of the Date output in the published query for the data source. At data.push is for the Amount and packet.Amount part, which points to the name of the Amount output in the published query for the data source.
Data defined in published queries in this way is available to the JavaScript code side.
All other codes are standard codes for writing line graphs with Chart.JS, so please refer to the Chart.JS specifications.
Packing HTML + JavaScript code into published queries
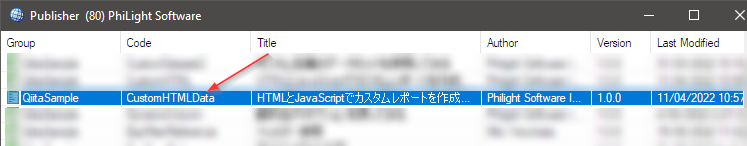
Define a published query in the Publisher that will be the container for the code written above.
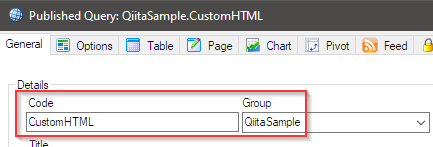
Code and Group
Create a new one and fill in the Code and Group.
Edit query
In this case, there is no need to define a query for the container, but since there is a condition that A published query must have a query definition, anything is fine, so let's define a simple query. However, as mentioned above, this time I will define the call URL of the published query for the data source as an expression within this query.
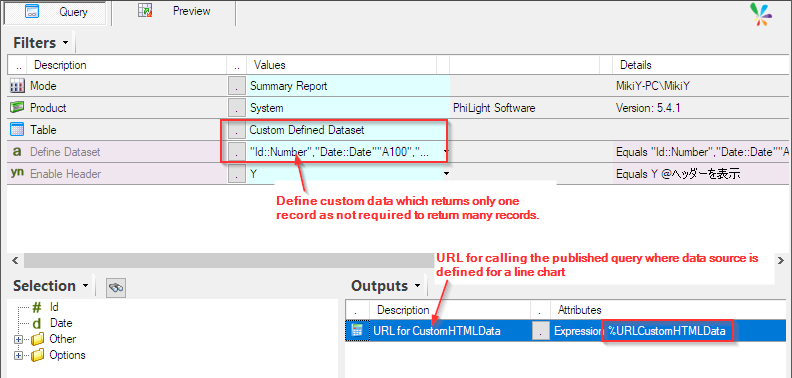
Note the name %URLCustomHTMLData of the expression, it is used here in the code.

This concludes the definition of the query for the container.
Enclosing and using the code
Go to the Options tab in the Published Query dialog. And use these two properties.
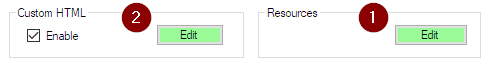
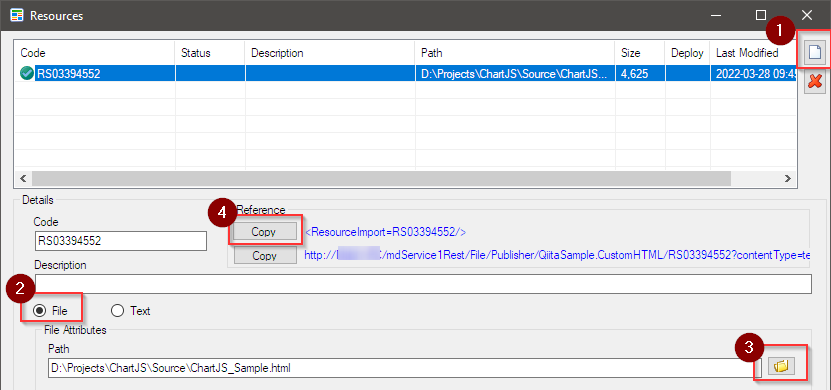
Code enclosing uses the resource option. Clicking on the Resources option button brings up a dedicated dialog. 1: Add an item with the [New] button, and 2: select the File option. After that, 3: Specify the HTML code file described with the file reference button. Finally, 4: Copy the reference code and finish with the [Close] button.
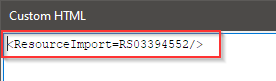
Then click the Edit button for the Custom HTML option. A custom HTML text editor will appear, where you can paste the reference code was saved on the clipboard.
Press OK to save it. Save also the published query and now let's see it in action.
Operation check
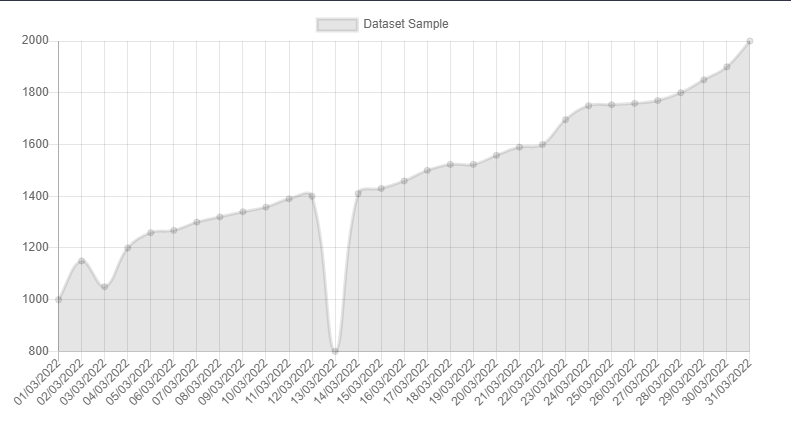
Just start the Sharperlight service and paste this URL into your browser's address bar. ![]()
http://{YourServerName}/mdService1Rest/Report/?query=QiitaSample.CustomHTML
A line graph like this will appear.
![]() Sharperlight
Sharperlight